
Fig. 1.
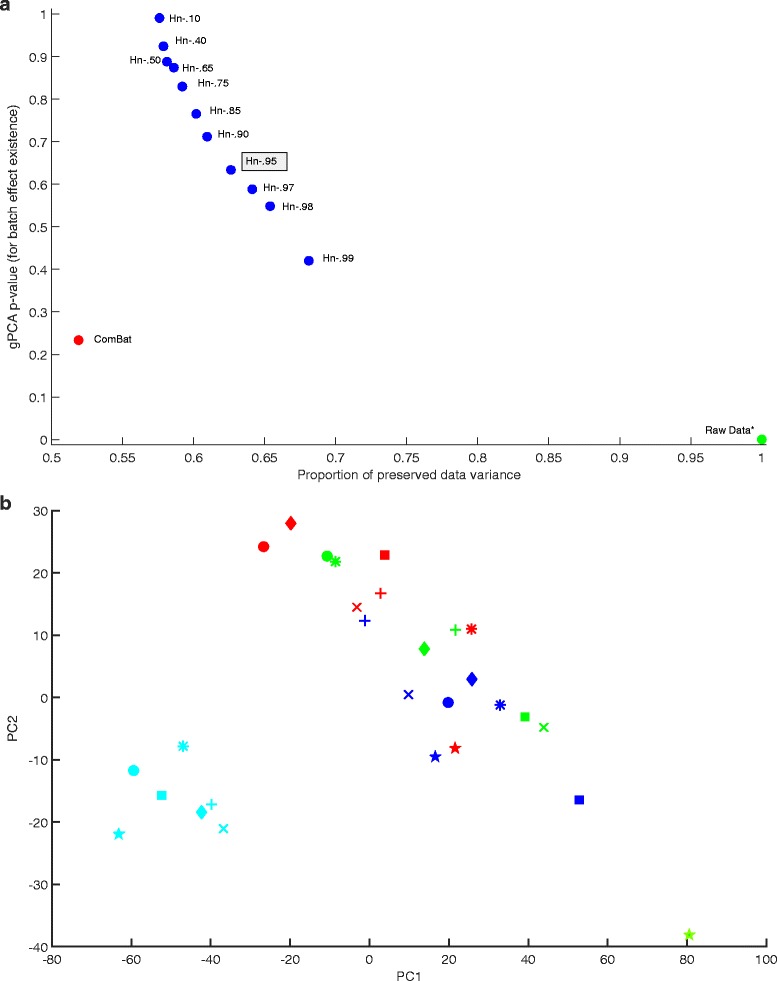
a gPCA p-value vs preserved data variance plot for Dataset 1 (Osmond-McLeod, Osmond et al., 2013), showing the scores for data before correction (*gPCA = .008), and after correction by ComBat and Harman batch effect removal methods. For Harman, the fractions in the labels denote the adjustable confidence threshold (=1-probability of overcorrection) for batch noise removal. Hn-.95 is highlighted as it may be the setting of choice for a typical dataset. On the vertical, the larger the p-value the lower the probability of batch noise presence as detected by gPCA (Reese et al, 2013). Raw data p-value of .008, indicates a prevalent batch noise component in the uncorrected dataset. The figure shows that ComBat falls below the Harman curve, indicating Harman’s superiority in terms of removing batch noise and preserving biological signal in the dataset. b First and second PCs for Dataset 1 (Osmond-McLeod, Osmond et al., 2013) before correction. The four colours represent the four processing batches. The shapes represent seven distinct treatments. The clustering of batches indicate the presence of batch effects in the first and second PCs of the data