
Fig. 5.
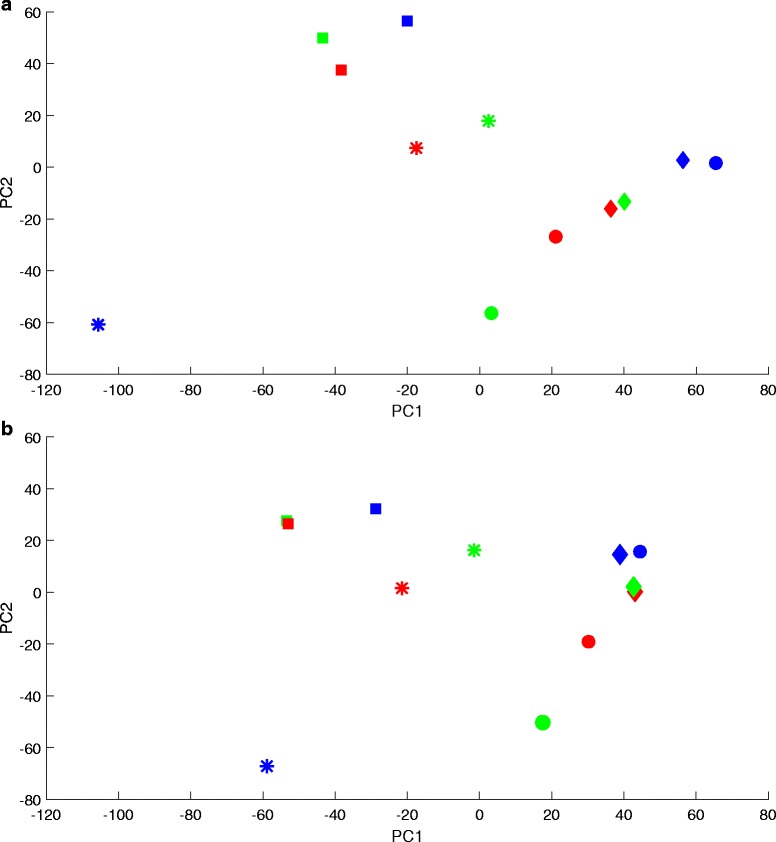
a A plot of first and second PCs for Dataset 3 (Johnson et al., 2007) after correction by Harman (.10). The three colours represent the three processing batches. The shapes represent four distinct experimental conditions. b A plot of first and second PCs for Dataset 3 (Johnson et al., 2007) after correction by ComBat. The three colours represent the three processing batches. The shapes represent four distinct experimental conditions