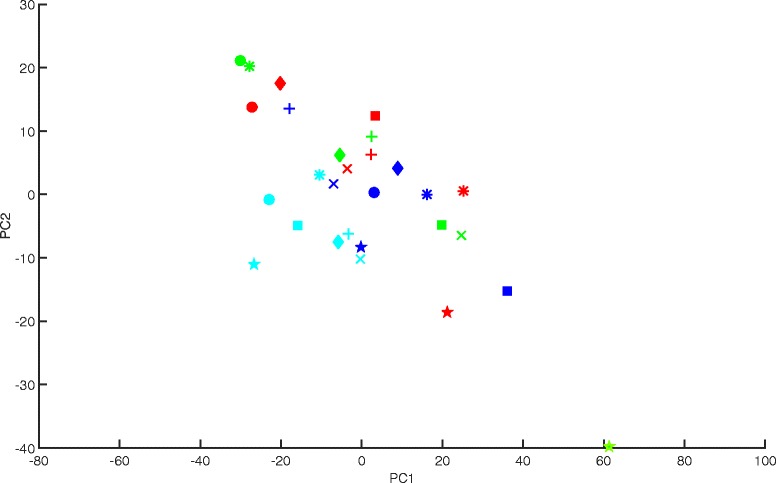
Fig. 8.

First and second PCs for Dataset 1 (Osmond-McLeod, Osmond et al., 2013) after correction by Harman with a confidence limit of .95. The four colours represent the four processing batches. The shapes represent seven distinct treatments. The clustering of batches before correction (Fig. 1b) indicate the presence of batch effects in the first and second PCs of the data. After correction, the batch means are reduced to .26 (PC1) and .33 (PC2) of their original values
