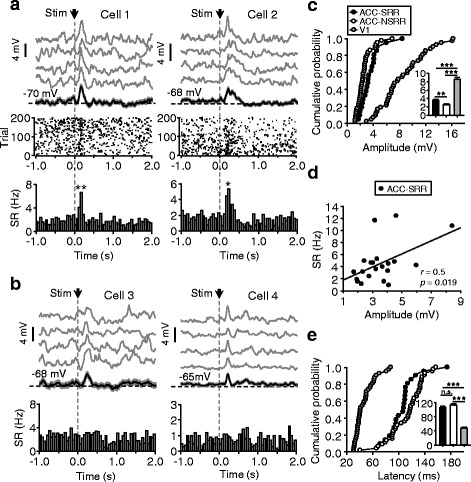
Fig. 2.

Properties of ACC and V1 responses to flash stimuli. a Two example recordings showing both MP and SR responses. Top, average MP responses; gray and black (with shadowed areas that indicate SEM) traces represent the averages of 50 consecutive and all (200) trials, respectively. Black dash line, mean MP. Middle and bottom, raster plots (middle) and peristimulus time histograms (PSTHs; bin width, 50 ms) (bottom) of SR responses. Arrows and gray dash lines, time points of stimulus onset. b Two example cells with MP responses (top) but no SR responses (PSTHs shown at bottom). c Cumulative distribution plots for the peak amplitudes of MP responses recorded from the ACC neurons that exhibited SR responses (ACC-SRR; n = 21) and not (ACC-NSRR; n = 44) and from V1 neurons (n = 42; recordings with and without SR responses were both included). Histograms in insets: mean ± SEM. d For ACC neurons showing SR responses, peak amplitudes of MP responses plotted against SR; line, linear regression fits. e Same as (c), for response latencies. *p < 0.05, **p < 0.01
