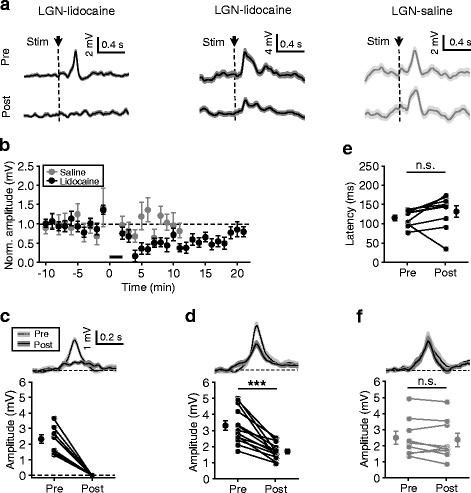
Fig. 4.

Blocking effects of local LGN-lidocaine infusion on ACC responses to flash stimuli. a Example data showing average pre- and post-infusion MP responses, in which the responses were totally (left) or partially (middle) blocked by lidocaine and were unchanged by saline (right). In these experiments, 1 μl lidocaine or saline was bilaterally infused in LGN, and, for each infusion site, application was the same as the experiments shown in Fig. 3 (a and b). b Summary of all experiments shown in (a) (n = 22 for lidocaine group, in which, all cells were recorded for at least 10 min after drug infusion and 16 cells for ~22 min; n = 9 for saline group); data were normalized to the amplitude of pre-infusion responses; thick bars represent drug application. c and d For cells with responses totally (c) (n = 9) or partially (d) (n = 13) blocked by lidocaine treatment. Top, pre- and post-infusion responses averaged across population data in reference to the peak time of pre-infusion responses. Bottom, plots for pre- and post-infusion response amplitudes of all individual recordings; for no significant responses, corresponding values were plotted at 0 mV; dots connected by lines, measurements from the same cells; dots with bars, mean ± SEM. e For the cells shown in (d) but with post-infusion responses exceeding 1.5 mV (n = 9), plots for their onset latencies. f Same in (c and d), for all individual recordings of saline controls (n = 9). *** p < 0.001, n.s., not significant
