Fig. 7.

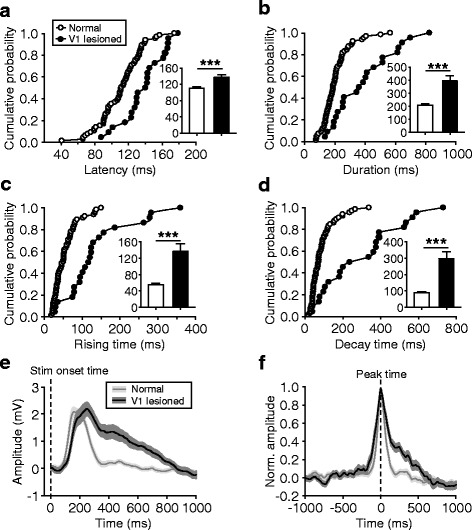
Changes in the temporal profile of ACC responses by large-scale visual cortical lesions. a–d For the responses of normal and V1-lesioned groups, cumulative distributions and mean values (insets) of the onset latencies (a), durations (b), rising times (c), and decay times (d). e and f Responses averaged across population data in reference to stimulus onset times (e) and in reference to response peak times (f)
