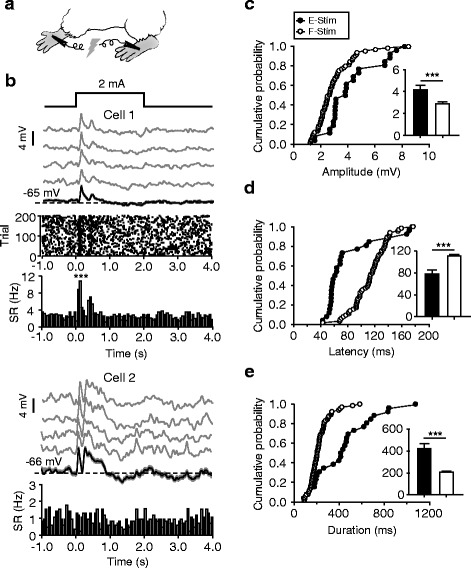
Fig. 9.

Excitatory responses of ACC neurons to electrical stimuli. a Schematic of DC stimulation delivered to hind paws. b Two example ACC neurons showing electrical stimulus-evoked MP responses that generated SR responses (Cell 1) and not (Cell 2). Data are presented as in Fig. 2a, b inset at top indicates the application of the DC electrical stimulus (2 mA, 2 s). c–e For the MP responses evoked by electrical stimuli (E-Stim, n = 26) and flash stimuli (F-Stim, n = 65; experiments shown in Fig. 2), cumulative distribution plots for peak amplitudes (c), onset latencies (d), and durations (e). Histograms in insets: mean ± SEM. ***p < 0.001
