
Fig. 1.
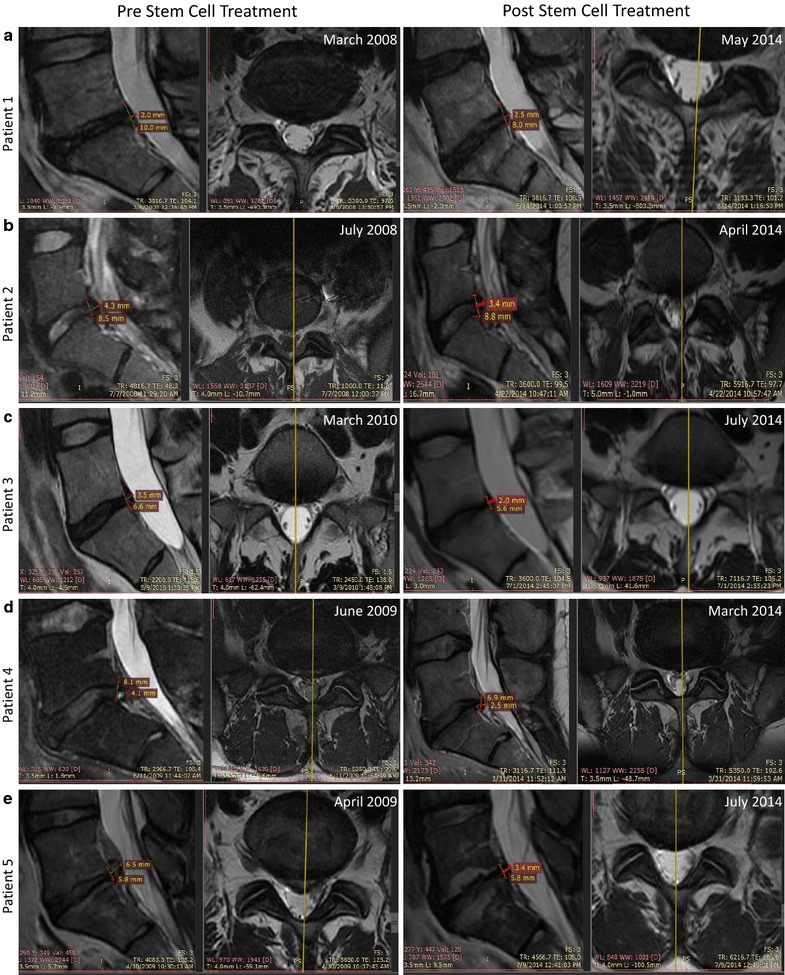
Patients MRI pre- and post- autologous, hypoxic cultured MSCs intra-discal injection. MRI pre- (left panels) and post- (right panels) stem cell treatment are shown for patient 1 (a), patient 2 (b), patient 3 (c), patient 4 (d), and patient 5 (e). Measurements of the posterior disc height and protrusion size at the L5–S1 level are indicated on each image as well as the date at which the MRI imaging was performed