
Fig. 1.
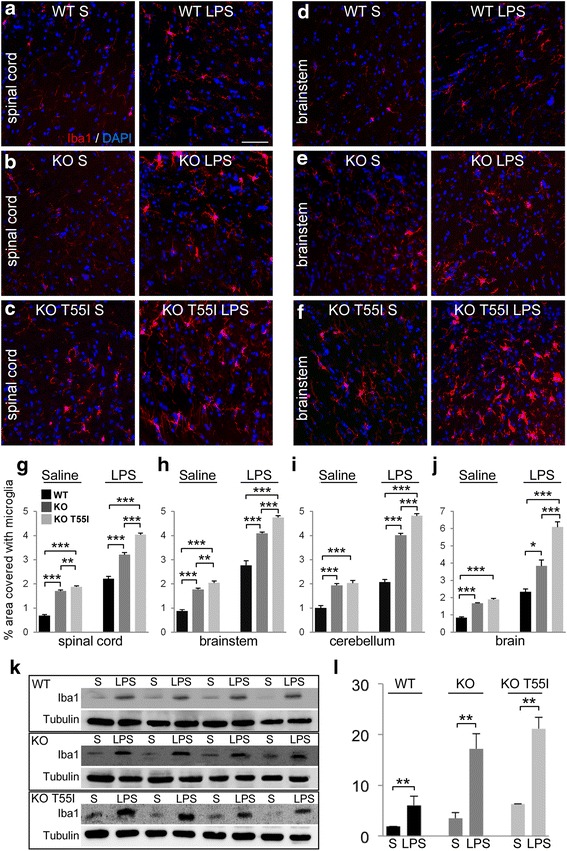
Diffuse CNS inflammation induced by systemic LPS injection. Images of fixed longitudinal sections of spinal cord (a–c) and brainstem (d–f) as indicated immunostained for microglial marker Iba1 (red) 1 week after injection. Nuclei are counterstained with DAPI (blue). LPS activates microglia in both CNS areas and in all genotypes (WT = wild type; KO = Cx32 KO; KO T55I = Cx32 KO/T55I mutant) compared to saline-injected mice. Scale bars in a–f: 50 μm. g–j Quantification of Iba1 immunofluorescence (% of total area) in different CNS areas (mean ± SEM) in n = 5 mice per group shows a significant increase in LPS-injected mice compared to controls in all areas studied across all genotypes. KO T55I tissues show the highest levels of activated microglia (data shown in Additional file 3: Table S1). Immunoblot analysis of Iba1 levels (band at 17 kDa) in brainstem lysates from WT, KO and KO T55I-(LPS) and saline-injected (S) mice, as indicated (k) and quantification (l) of Iba1 levels (specific band intensity, normalized for loading with tubulin re-blotting) confirms a significant elevation in LPS compared to saline injected mice of all genotypes, with the highest elevation in KO T55I mice (only significant values are shown, Student’s t-test, *:p < 0.05, **:p < 0.01, ***:p < 0.001, Bonferroni corrected)