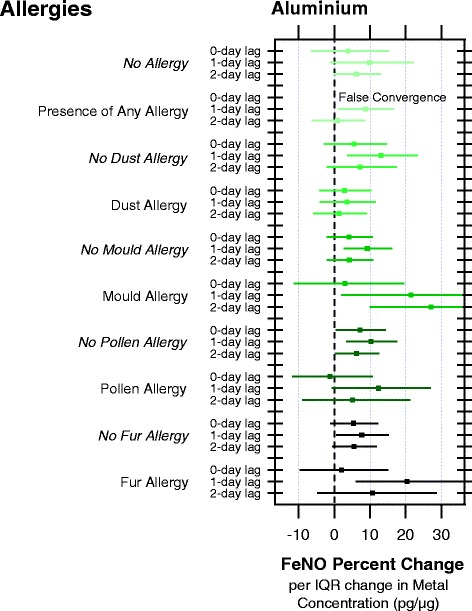
Fig. 2.

Percent change in FeNO per IQR change (95 % confidence limit) in aluminium concentrations from personal exposures to PM2.5 over a 0-, 1- and 2- day lags as modified by the presence of allergies (dust, mould, pollen, fur)

Percent change in FeNO per IQR change (95 % confidence limit) in aluminium concentrations from personal exposures to PM2.5 over a 0-, 1- and 2- day lags as modified by the presence of allergies (dust, mould, pollen, fur)