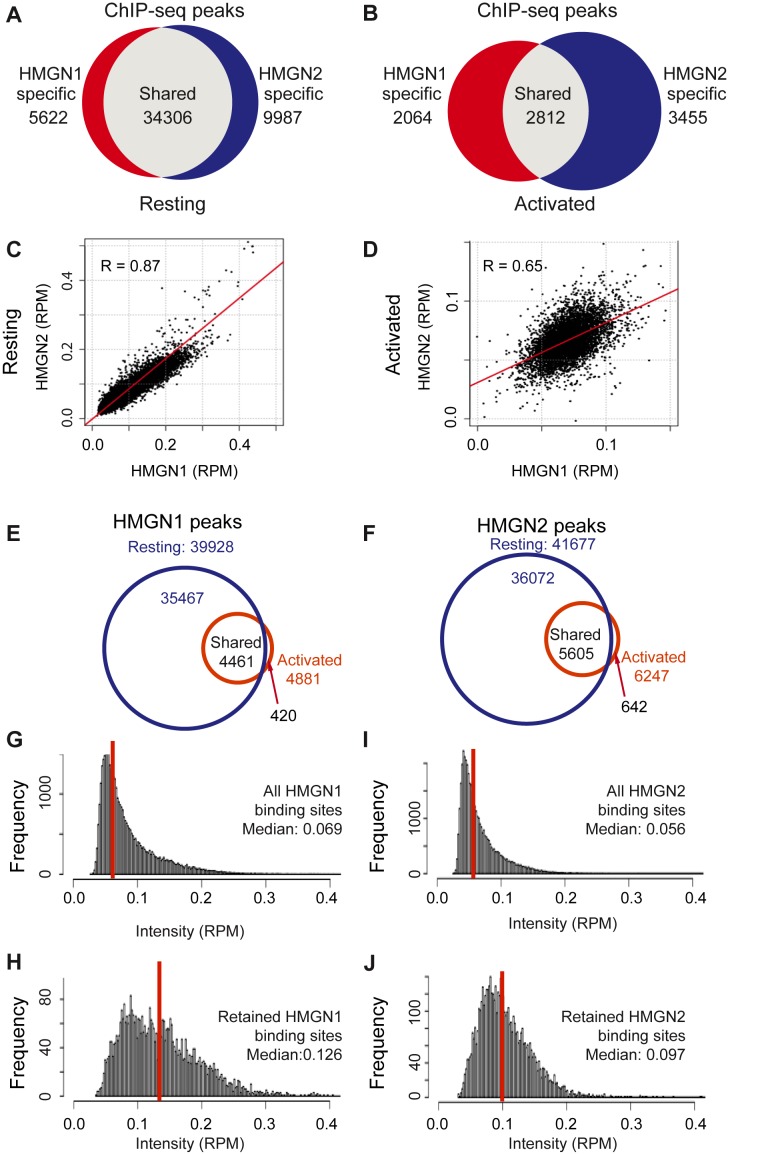
Figure 1.
LPS + IL4 induced activation of B cells alters the binding of HMGN proteins to chromatin. (A and B) Venn diagrams showing the overlap between HMGN1 and HMGN2 binding sites in resting (A) and activated (B) B cells, as determined by ChIP-Seq. Binding sites were identified by SICER, with an E-value cutoff of 0.1. (C and D) Scatter plots showing similar binding intensities of HMGN1 and HMGN2 in resting (C), but not in activated (D) B cells. R = Pearson correlation coefficient. (E and F) Venn diagrams showing the overlap in HMGN1 and HMGN2 occupancy between resting and activated cells. (G and H) Histogram showing signal intensities (RPM) in resting B cells at all HMGN1 binding sites (G) or only at HMGN1 binding sites retained after activation (H). (I and J) Histogram showing signal intensity (RPM) in resting B cells at all HMGN2 binding sites (I) or only at HMGN2 binding sites retained after activation (J).

