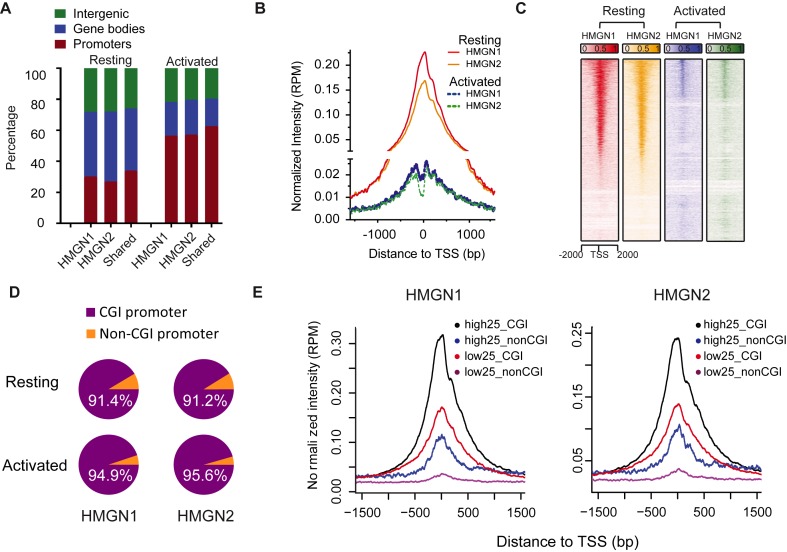
Figure 2.
HMGN proteins are enriched at CGI promoters. (A) Global distribution of HMGN1 and HMGN2 throughout the genome. (B and C) Enrichment profile and heat map representation of relative occupancy of HMGN1 and HMGN2 at TSS regions. (D) Most of HMGN1 and HMGN2 binding promoters are CGI containing promoters. (E) HMGN1 and HMGN2 are most enriched at CGI containing promoters of highly expressed genes. Shown are average HMGN signals at promoters that either do, or do not, contain CGI sorted by high and low expression levels. High25 and low25 indicate top 25% genes with highest and lowest expression level, in resting B cells, as measured by RNA-seq. Genes with expression level below 0.5 RPKM were excluded from the analysis.

