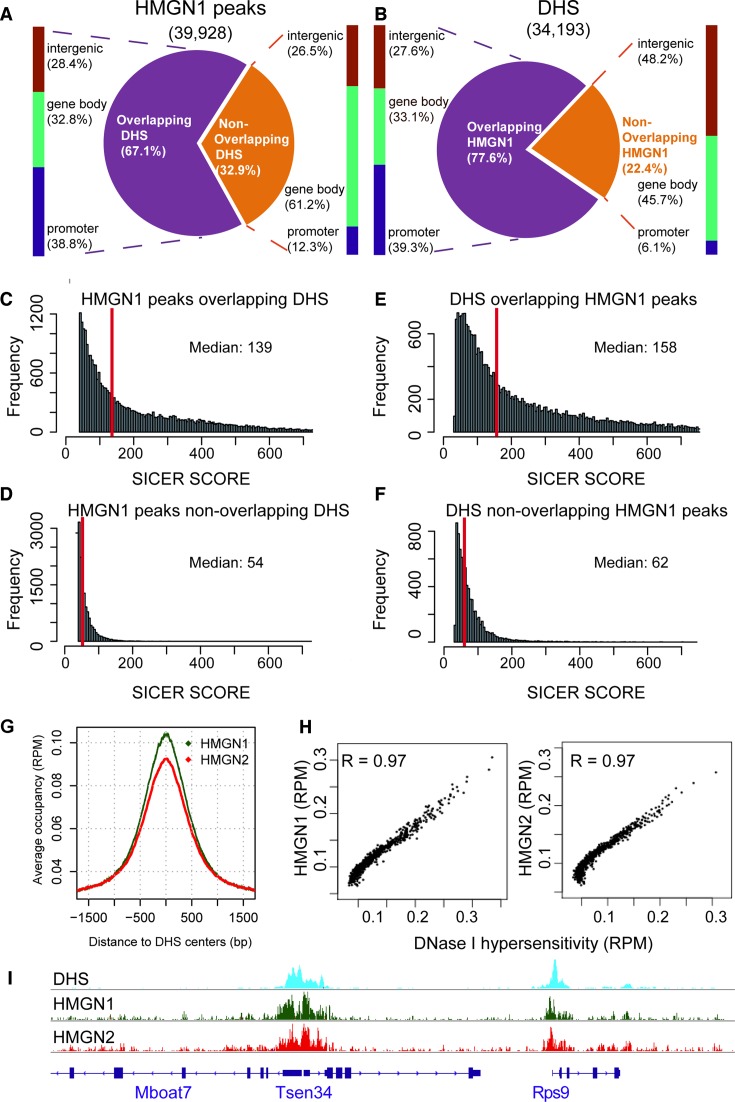
Figure 3.
Co-localization of DHSs and HMGN1 binding sites in resting B cells. (A) Distributions of HMGN1 peaks that either do or do not overlap DHSs. (B) Distribution of DHSs that either do, or do not overlap HMGN1 peaks. (C–F) HMGN1 and DHSs overlapping regions have stronger signal intensities than the non-overlapping regions. (G) Enrichment of HMGN1 and HMGN2 at DHSs. (H) Scatter plot showing co-localization of DHSs with HMGN1 (left) and HMGN2 (right). Normalized coverage depths for HMGNs and DHSs were sorted by DHSs coverage depth, grouped into 100 data point bins and averaged. The Pearson correlation coefficient (R) was calculated for the binned data. (I) Genome browser snapshot visualizes the co-localization of HMGN1 and HMGN2 binding sites with DHSs.

