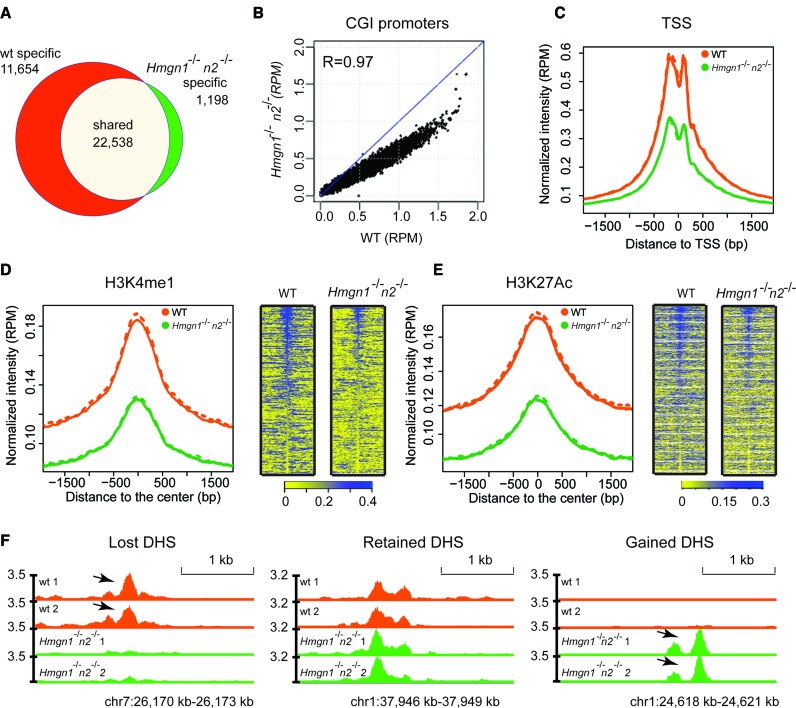
Figure 4.
Loss of HMGN1 and HMGN2 proteins reduces DHSs intensity in the chromatin of resting B cells. (A) Venn diagrams showing the DHSs overlap between WT and Hmgn1−/−n2−/- resting B cells. (B) Scatter plot showing the difference in the intensity of DHSs between WT and Hmgn1−/−n2−/- cells. DHS signals are normalized by library size and averaged over two biological replicates over each site, in reads per million of reads (RPM). (C–E) Loss of HMGNs reduces the DHSs intensity at TSS and at the chromatin regions with the indicated histone marks. Solid line and dotted line represent two biological replicates. (F) Genomic browser snapshot visualizing lost, retained and gained DHSs in Hmgn1−/−n2−/- cells. Two biological replicates are shown for the DHSs maps. Numbers next to Y axis indicate the scales in RPM.

