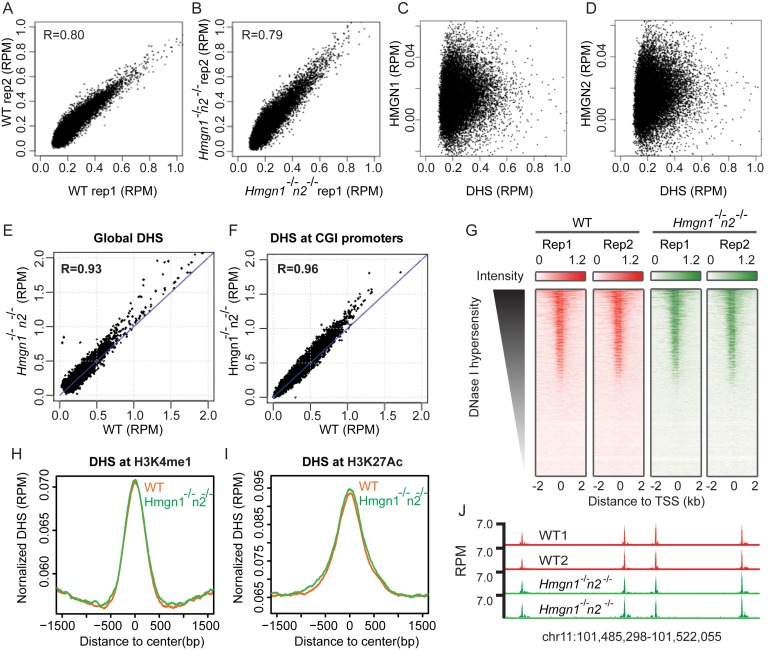
Figure 5.
Loss of HMGN1 and HMGN2 does not significantly change DHSs landscape in activated B cells. (A and B) Scatter plot showing similar intensity of DHSs between two biological replicates. (C and D) Scatter plot showing poor correlation between HMGN binding sites and DHSs in activated B cells. (E and F) Scatter plot showing similar intensity of DHSs between WT and Hmgn1−/−n2−/− cells at global DHS sites and CGI promoters. DHSs signals are averaged over two biological replicates. (G) Heat maps of DHSs intensities at TSS region in two biological replicates of WT and Hmgn1−/−n2−/− cells. (H and I) Normalized average intensity of DHSs in WT and Hmgn1−/−n2−/− cells at H3K4me1 and H3K27ac marked regions. (J) Genomic browser snapshot visualizing the DHSs in WT and Hmgn1−/−n2−/− cells.

