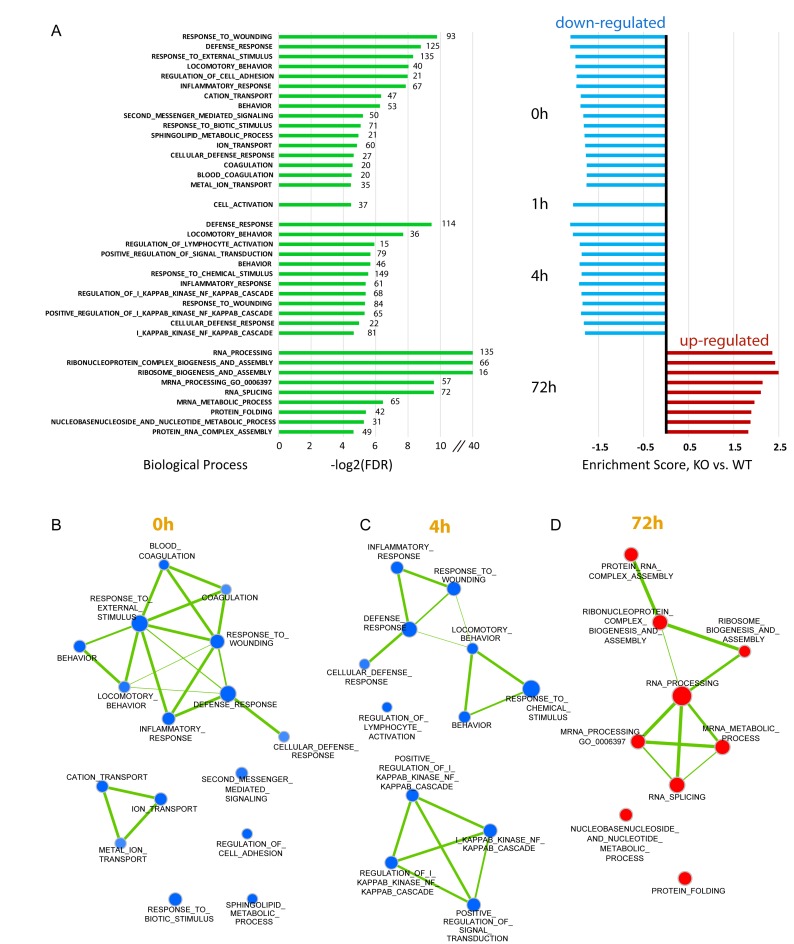
Figure 8.
Loss of HMGN1 and HMGN2 affects the expression of genes involved in immune response and signal transduction. (A) Gene enrichment analysis by GSEA. The transcriptome data of WT and Hmgn1−/−n2−/− cells (with three replicates) at each time point were submitted as input and GS biological process sets (c5.all.v5.0.symbols.gmt) were used as reference. FDR threshold is 0.05. All the identified processes are shown. Green bars on the left side show the log2 (FDR) for the process identified with the numbers at the end of the green bars indicating the number of genes in that process. Bars on right side are the normalized enrichment fold with blue indicating down regulated processes and red showing upregulated processes. (B–D) Interaction maps between the identified pathways at the time point 0, 4 and 72 h were made with Cytoscape based on results in panel A. Node size represents the gene set size and line width represents the similarity coefficient of two connected nodes.

