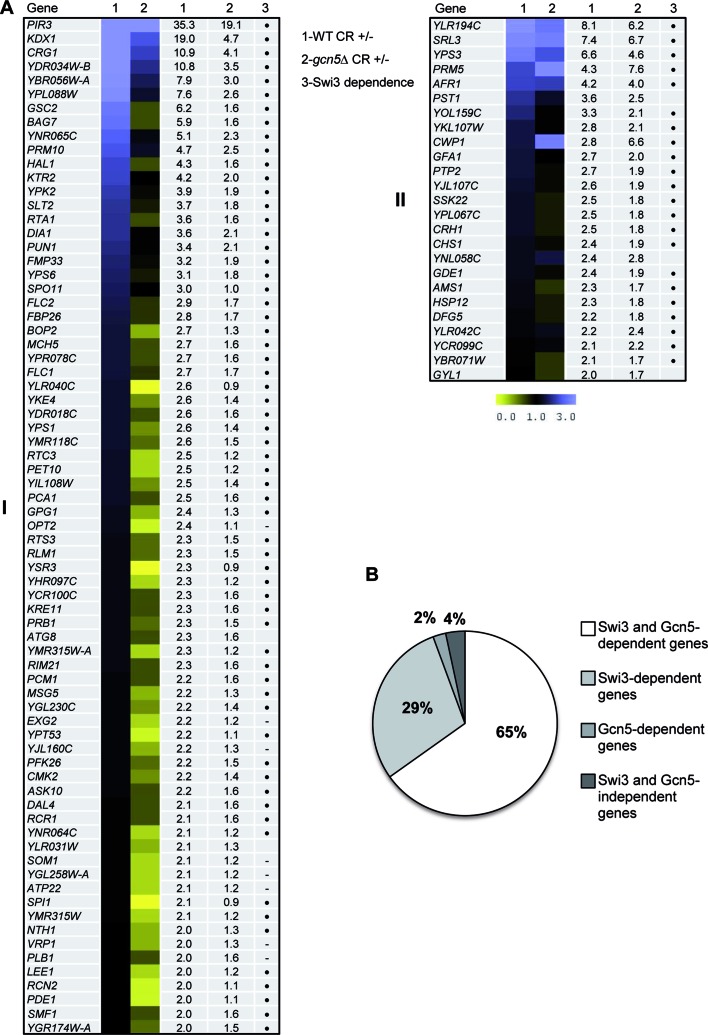
Figure 2.
Genome-wide expression profiles of wild-type and gcn5Δ strains after CR treatment. (A) The heat map obtained by the MeV 4.9 software shows gene expression ratios comparing the transcriptional response to CR (3 h) (treated versus untreated) in WT and gcn5Δ strains (columns 1 and 2), respectively. The degree of color saturation represents the expression log2 ratio value, as indicated by the scale bar. Numeric ratio values are also included in additional columns. Those genes upregulated in the WT strain by CR treatment were grouped based on the dependence on Gcn5 (see ‘Materials and Methods’ section for details): (I) genes whose induction was dependent on Gcn5 and (II) genes induced by cell wall stress independently on Gcn5. Swi3 dependence for all genes according to previously published data (9) is also indicated with a dot (hyphen represents no data available). (B) Schematic representation of the comparison of the transcriptional profiles of gcn5Δ and swi3Δ (9) mutants after CR treatment respect to the WT strain. Data are represented as the % of genes dependent on Swi3, Gcn5 or both.

