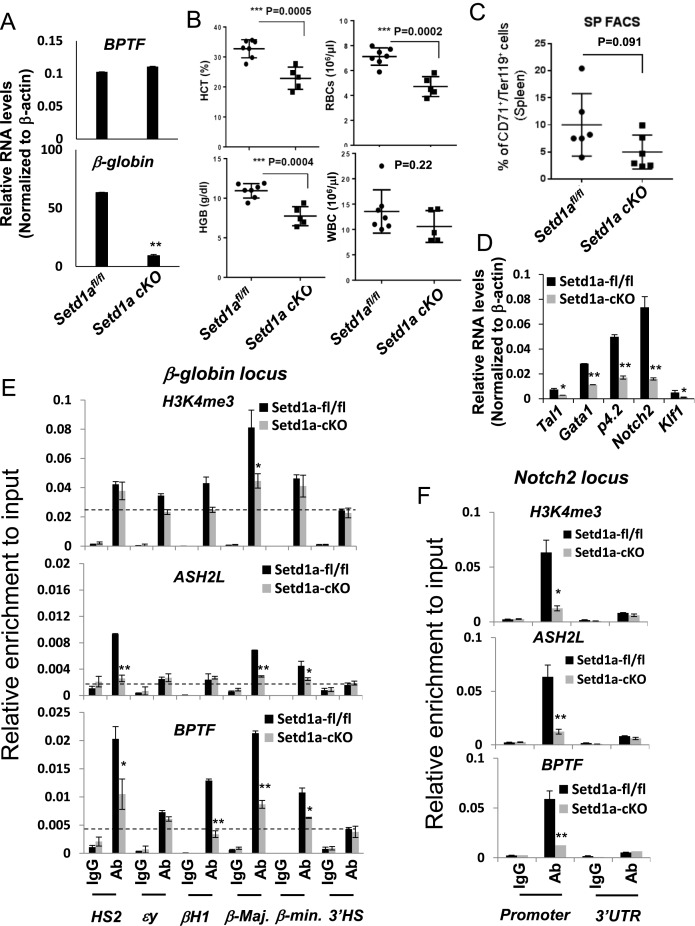
Figure 1.
Loss of Setd1a in the erythroid compartment impaired erythropoiesis (A) qRT-PCR analysis of bptf and β-globin expression comparing two represented pairs of the Setd1afl/fl and Setd1a CKO mice. qRT-PCR analysis for each pair has been repeated three times. Data are shown as mean ± SD. *P < 0.05; **P < 0.01 by student t-test. (B) Peripheral blood analysis of hematocrit (HCT), red blood cells (RBCs), white blood cells (WBCs) and hemoglobin (HGB) levels in the seven controls and the five Setd1a KO mice. The unpaired t-test was performed to determine the statistical significance. *P < 0.05; **P < 0.01; ***P < 0.001. (C) FACS analysis of CD71 and Ter119 positive erythroblast in spleen comparing six pairs of the Setd1afl/fl and Setd1a KO mice in which two male mice and four female mice at three months of age were used. The unpaired t-test was performed to determine the statistical significance. *P < 0.05; **P < 0.01; ***P < 0.001. (D) qRT-PCR analysis of genes important for erythroid differentiation comparing two represented pairs of the Setd1afl/fl and Setd1a CKO mice. qRT-PCR analysis for each pair has been repeated three times. Data are shown as mean ± SD. *P < 0.05; **P < 0.01 by student t-test. (E and F) ChIP analysis of H3K4me3, ASH2L occupancy and BPTF recruitment at β-globin (E) and Notch2 (F) loci in one represented pair of the Setd1afl/fl and Setd1a CKO BM cells with three technical repeats. Data are shown as mean ± SD. *P < 0.05; **P < 0.01 by student t-test.

