Figure 2.
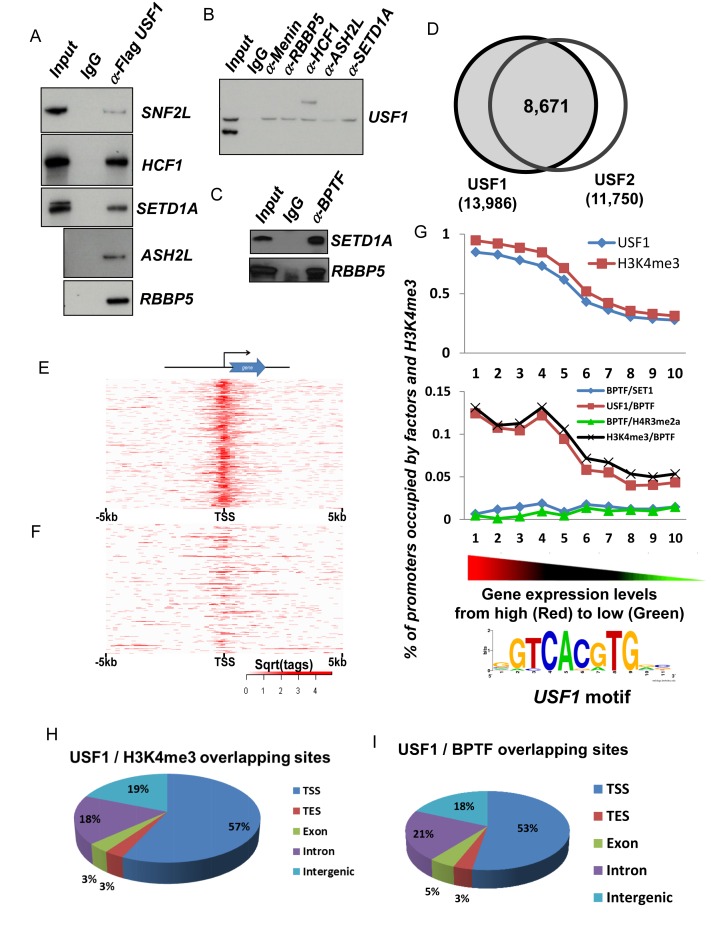
Correlation of USF1, H3K4me3 and NURF complex genome wide occupancy and gene expression patterns of erythroid genes (A and B) western blot analysis of reciprocal co-immunoprecipitation performed in Hela NEs with antibodies against flag-tagged USF1 (A) or a component of the Setd1a complex (B). (C) Western blot analysis of Setd1a and RBBP5 protein immunoprecipitated by BPTF antibody, a specific component of the NURF complex. (D) Global colocalization of USF1 and USF2 at proximal promoters of ChIP-seq identified genes in erythroblast cells. (E and F) Heat map showing USF1 localization at top 1000 expressed erythroid genes (E) and bottom 1000 silenced genes (F). (G) Colocalizion of USF1, H3K4me3 and NURF (BPTF) complexes at gene promoters correlates positively with gene expression levels in erythroid cells. The USF1 motif was predicted by MEME analysis suite using the top 1000 USF1 binding peaks (according to the intensity of binding profiles). (H) Global colocalization of USF1 and H3K4me3 in erythroid cells. TSS, transcription start site; TES, transcription termination site. (I) Global colocalization of USF1 and NURF complexes in erythroid cells. For ChIP-seq assays, average reads per sample for BPTF, H3K4me3, SETD1A, USF1 and USF2 were 28.04, 28.38, 33.75, 10.38 and 8.33 million reads. The ChIP-seq peaks were identified using MACs with a (default) cutoff of 1.00e-05.

