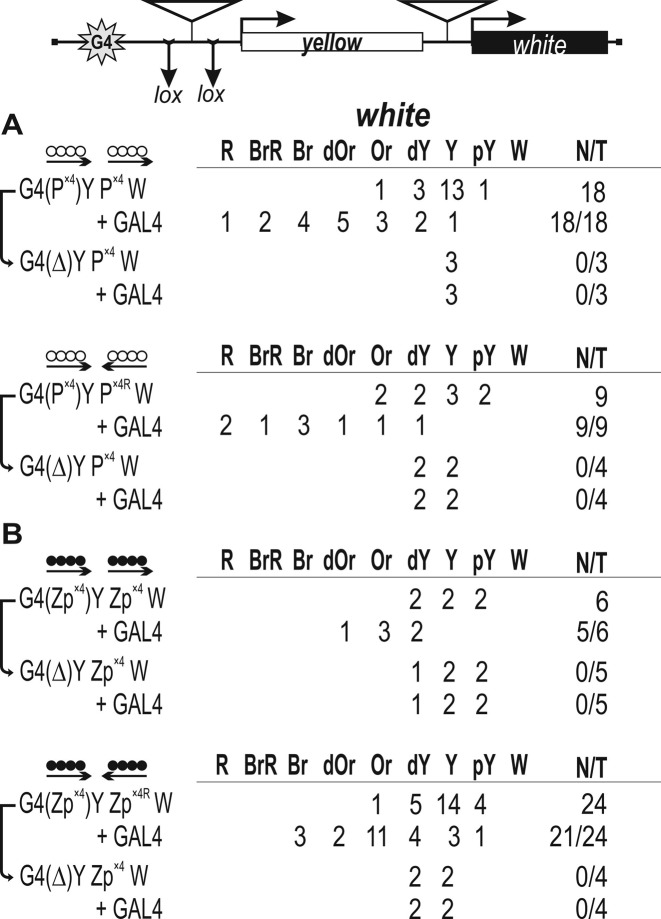
Figure 4.
Testing for the functional interaction between DNA fragments containing binding sites for (A) Pita (white circles) or (B) ZIPIC (black circles) in the GAL4/white model system. At the top is a reductive scheme of transgenic construct used to examine the functional interaction between the binding sites for the test proteins. The GAL4 binding sites (indicated as G4) are at a distance of 5 kb from the white gene. The yellow gene is inserted between the GAL4 binding sites and the white promoter. ‘+GAL4’ indicates that eye phenotypes in transgenic lines were examined after induction of GAL4 expression. The yellow and white genes are shown as boxes, with arrows indicating the direction of their transcription. The inverted triangles indicate sites that used for insertion of tested DNA fragments. Downward arrows indicate target sites for Cre recombinase (lox). The same sites in construct names are denoted by parentheses. The superscript index ‘R’ indicates that the corresponding element is inserted in the reverse orientation in the construct. The ‘white’ column shows the numbers of transgenic lines with different levels of white expression. The wild-type white expression determined the bright red eye color (R); in the absence of white expression, the eyes were white (W). Intermediate levels of pigmentation, with the eye color ranging from pale yellow (pY) through yellow (Y), dark yellow (dY), orange (Or), dark orange (dOr) and brown (Br) to brownish red (BrR), reflect the increasing levels of white expression. N is the number of lines in which flies acquired a new white (w) phenotype upon deletion (Δ) of the specified DNA fragment; T is the total number of lines examined for each particular construct.

