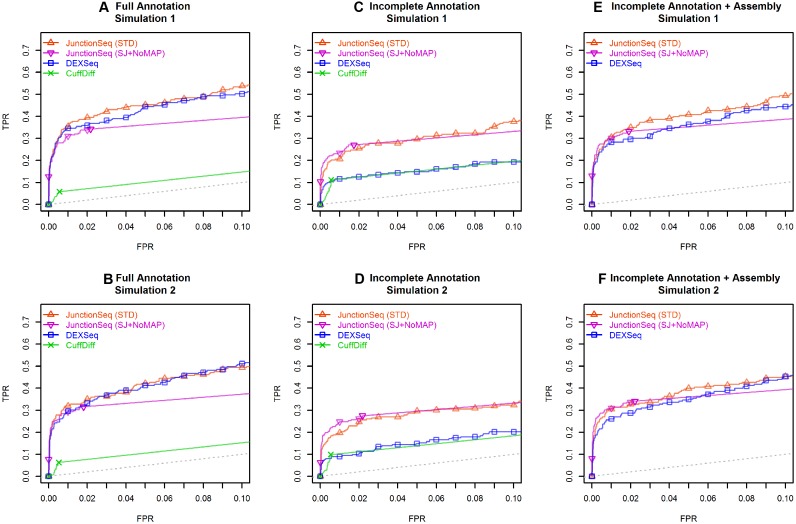
Figure 1.
ROC curves for JunctionSeq, DEXSeq, and CuffDiff for the two simulated datasets. This plot indicates how well each tool discriminates AIR genes from non-AIR genes. Plots A–C and D–F show the results for simulated datasets 1 and 2, respectively. The y-axis is the true positive rate (TPR, # true AIR genes detected / total # AIR genes), and the x-axis indicates false positive rate (FPR, # non-AIR genes detected AIR / total # of non-AIR genes). The ROC curve indicates the TPR/FPR over all possible adjusted P-value thresholds. Plots (A) and (B) show the results using the full annotation. (B) and (C) show the results using the incomplete annotation, and (E) and (F) show the results for DEXSeq and JunctionSeq using the incomplete annotation along with CuffLinks-assembled splice junctions and exonic regions. Two lines are drawn for JunctionSeq, displaying the results for a standard JunctionSeq run with the standard options (red), and for a secondary analysis with more conservative settings (only query splice junctions, do not use the maximum a posteriori dispersion estimates). Note that when provided with the complete annotation, both JunctionSeq and DEXSeq are able to discriminate AIR genes with approximately the same efficacy. However, when provided with the reduced annotation, with or without a CuffLinks assembly, DEXSeq has weaker discrimination than JunctionSeq. CuffDiff demonstrates low discrimination in all tests. The full-range ROC curves are available in the online supplement (see Supplemental Figure S20).

