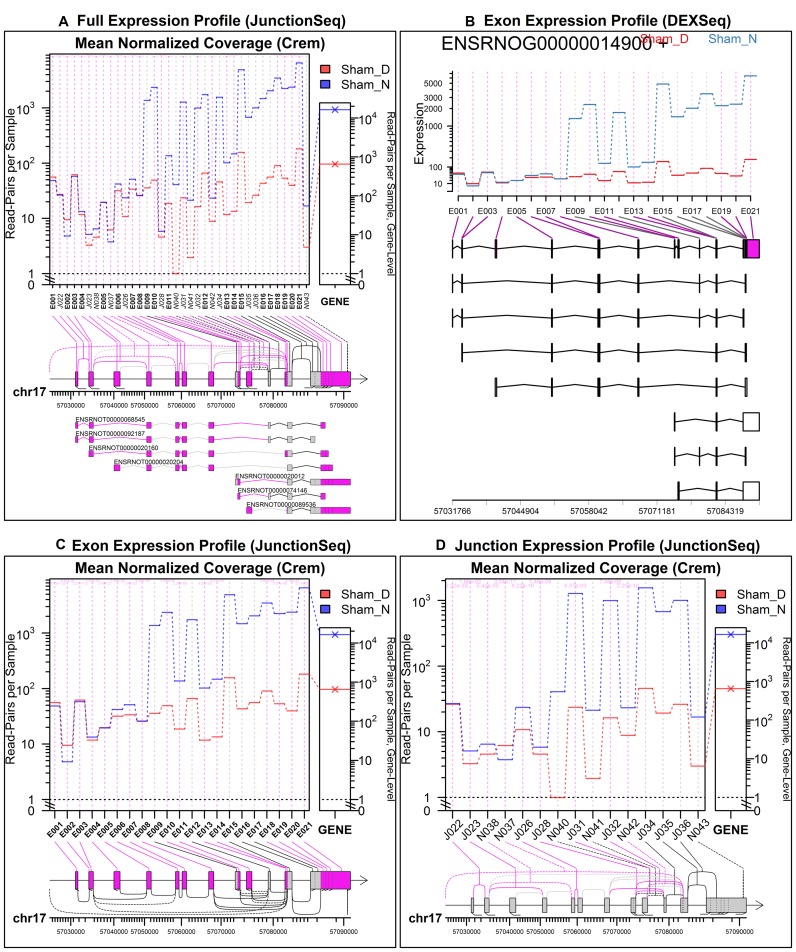
Figure 4.
Day/Night gene profile plots for the Crem gene in the rat pineal gland, sham-surgery group. Plots (A), (C) and (D) were produced by JunctionSeq, and (B) was produced by an equivalent analysis using DEXSeq. The full standard JunctionSeq gene profile plot (A) includes both exon and splice junction information. The equivalent DEXSeq plot (B) only displays exon information. Optionally, JunctionSeq can produce similar exon profile plots (C), or plots displaying only splice-junction information (D). Beneath the plotting regions in each figure a gene diagram displays the features’ positions on the genomic scale (note that small features are expanded for readability in the JunctionSeq versions). Novel junction loci are drawn using dashed lines. In the upper plots (A and B), all known transcripts are displayed beneath the main plotting area. Similar plots are available online for the control day/night comparison, as well as the two treated-vs-untreated comparisons (see Supplementary Figures S9–S11)

