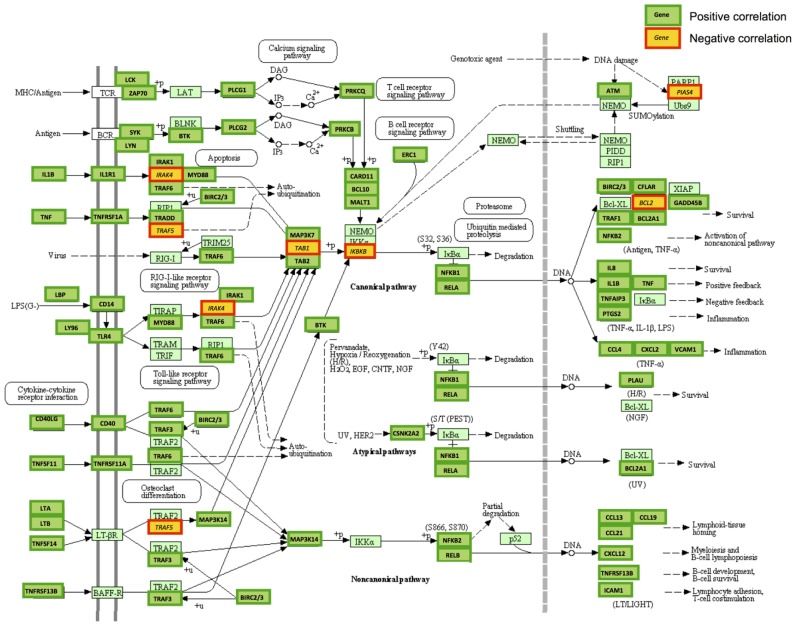
Figure 1.
NF-κB pathway genes with correlation to HOXA1 expression in breast cancer. Graphical overview of the NF-κB pathway showing pathway genes with a significant correlation to HOXA1 expression in the Bertucci-266 dataset. The KEGG NF-κB pathway graph with constituent genes (in pale green boxes with narrow border) is overlaid with boxes representing positively or negatively correlating genes (gene name on a green background with thick green border, or on a yellow background with thick red border, respectively). More details on correlations are in Table 1. The overview shows an almost comprehensive positive correlation with HOXA1 mRNA expression, strongly suggesting that the NF-κB pathway is activated by HOXA1 in breast cancer cells.

