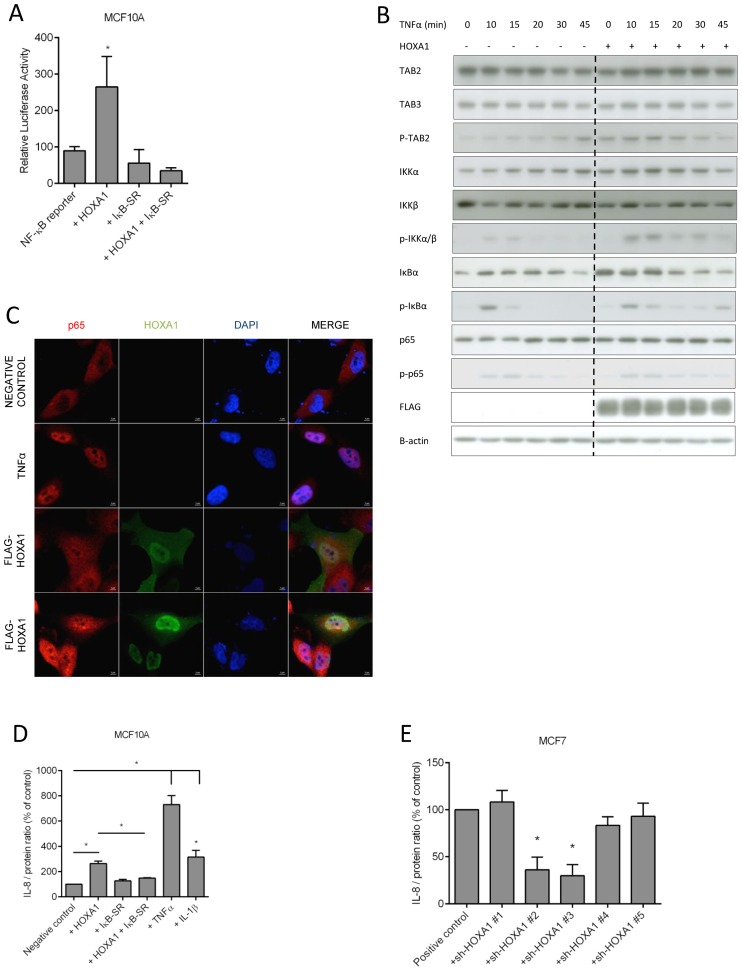
Figure 3.
Effect of HOXA1 on the NF-κB pathway. (A) The effect of a super repressor version of IκB (IκB-SR) on the HOXA1-mediated activation of the NF-κB reporter was assayed in MCF10A cells. Results are presented as a luciferase/β-galactosidase ratio (relative luciferase activity) and correspond to the means of three biologically independent duplicates ± SEM. Statistical analysis was performed with reference to the condition involving the NF-κB reporter alone (NF-κB reporter). (B) Western blot showing TAB2, TAB3, p-TAB2 (Ser372), IKKα, IKKβ, p-IKKα/β (Ser176/180), IκBα, p-IκBα (Ser32), p65 and p-p65 (Ser536) proteins from MCF10A cells transfected with a FLAG-HOXA1 expression plasmid or with a negative control, and treated with TNFα (25 ng/ml) for 0, 10, 15, 20, 30 or 45 min. A total of 25 ng/ml was chosen from a range of 0, 6.25, 12.5, 25, 50, 75 or 100 ng/ml as the lowest TNFα concentration to give full reporter activation. At this TNFα concentration, reporter activation is comparable between 30 min and 24 h (not shown). A total of 250 ng HOXA1 plasmid was chosen as the optimal transfection dose from a range of 0, 50, 100, 250, 500 or 750 ng as the lowest HOXA1 dose to give full reporter activation (not shown). Detection of β-actin was used as loading control. Bands corresponding to detected proteins were cropped for the sake of presentation but all samples were processed in parallel, being run together on single protein gels. The provided blots are representative of three biologically independent experiments. (C) p65 nuclear translocation was analyzed in MCF10A cells by confocal microscopy. The images represent the cellular localization of endogenous p65 (red channel) and FLAG-HOXA1 (green channel) from representative confocal Z-section at 120 times magnification. Cell nuclei were stained with DAPI (blue channel). (D) ELISA quantification of IL-8 secretion upon HOXA1, IκB-SR, and HOXA1 and IκB-SR expression, or after TNFα or IL-1β addition to MCF10A cells. IL-8 secretion was normalized to the protein content of the cell-culture well and data were calculated using the mean absorbance of two wells. The negative control was set to 100% and statistical analysis was carried out using the negative control as control level (*P < 0.0001). This is a representative experiment of three biologically independent duplicates ± SEM. (E) The involvement of HOXA1 in triggering IL-8 secretion was assayed as in (D) using sh-HOXA1 vectors in MCF7 cells. The positive control was set to 100% and statistical analysis was carried out using the positive control as control level (*P < 0.0001). This is a representative experiment of three biologically independent duplicates ± SEM.

