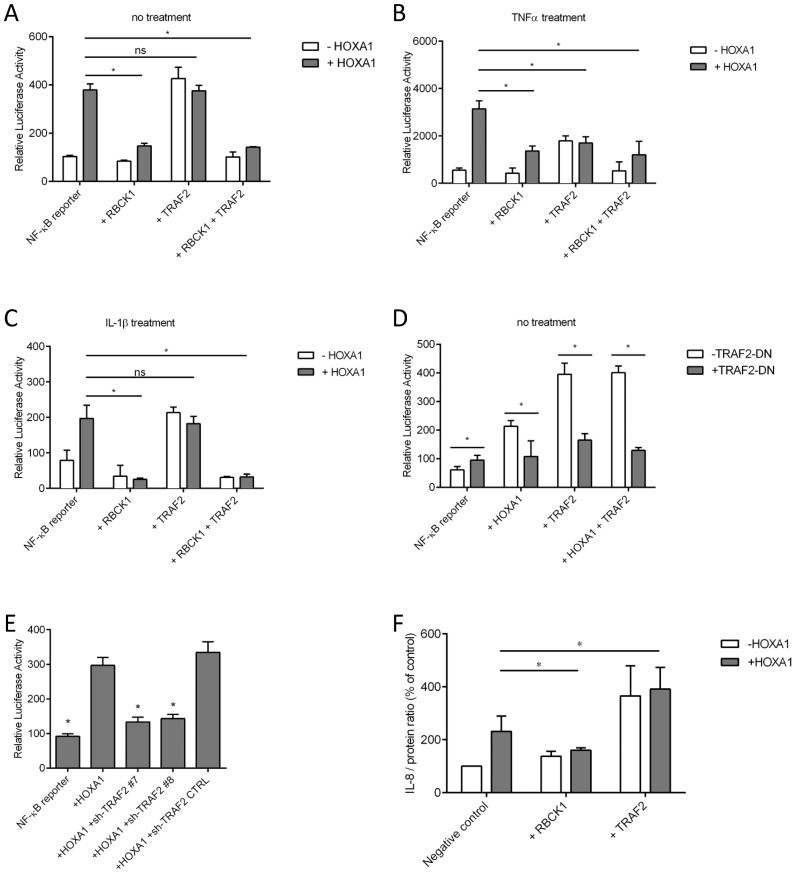
Figure 4.
Effect of RBCK1 and TRAF2 on the HOXA1-mediated activation of the NF-κB reporter. (A) Activity tests were performed using the NF-κB reporter where each interactor was transfected alone or in combination with HOXA1. Results are presented as a luciferase/β-galactosidase ratio (relative luciferase activity) and correspond to the means of three biologically independent duplicates ± SEM. (B) The same experiment was performed after stimulation of the pathway with TNFα. The experiments were performed with 30 min or 24 h TNFα stimulation, with similar results (not shown, see also legend to Figure 3B). (C) The same experiment was performed after stimulation of the pathway with IL-1β. (D) Effect of a dominant negative version of TRAF2 (TRAF2-DN) on the HOXA1-mediated activation of the NF-κB reporter. (E) Activity tests were performed using the NF-κB reporter where HOXA1 was transfected alone or in combination with sh-TRAF2 expression vectors. (F) ELISA quantification of IL-8 secretion upon RBCK1, TRAF2 and HOXA1 expression. IL-8 secretion was normalized to the protein content of the cell-culture well and data were calculated using the mean absorbance of two wells. The negative control was set to 100% and statistical analysis was carried out using the negative control as control level (*P < 0.0001). This is a representative experiment of three biologically independent duplicates ± SEM. The experiments for (A and D) were not performed at the same time, so variations in cell culture (e.g. passage number, confluence) and/or transfection could be different. All the experiments were performed in MCF10A cells. Data were obtained, processed and represented as in Figure 2. Statistical analysis was carried out (E) with the condition involving the NF-κB reporter alone (NF-κB reporter) as control level, or (A–D; F) using comparisons between groups. (*P < 0.0001; ns = not significant).

