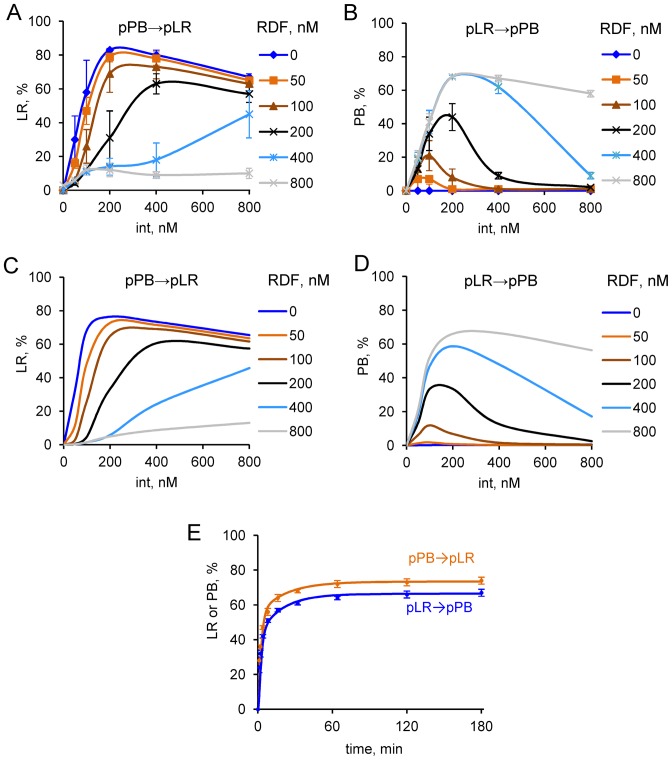
Figure 4.
Experimentally determined and modelled kinetics and protein concentration dependence of ϕC31 integrase-mediated recombination. (A–D) The dependence of recombination on integrase and RDF concentration in the experiments (A and B) and in Model 1 (C and D). Extent of recombination after 3 h was measured experimentally (A and B) or calculated using Model 1 (C and D) for the P × B (−RDF) reaction (A and C) and the L × R (+RDF) reaction (B and D), with the indicated integrase and RDF concentrations (plasmid substrate concentration 10 nM). (E) Time-courses of P × B (−RDF) and L × R (+RDF) reactions (orange and blue respectively). Reactions were with 10 nM plasmid substrate (pPB or pLR) and 400 nM integrase, and 800 nM RDF for the L × R (+RDF) reaction. The experimental data are shown by symbols and simulated kinetics (Model 1) by lines. Data points on A, B and E are shown as mean and standard deviation from three independent replicates of the experiments.

