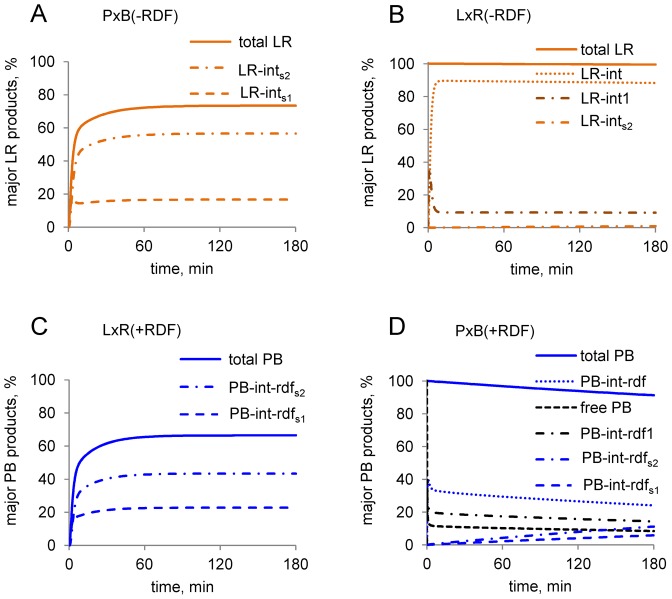
Figure 6.
Simulated time courses of the amounts of abundant DNA-containing species in Model 1. (A and B) Reactions without RDF. Graphs show the amounts of the most abundant pLR species. These are LR synapses (LR–ints1, LR–ints2) in A and LR complexes with one (LR–int1) or two (LR–int) integrase dimers in B. (C and D) Reactions with RDF. Graphs show the amounts of the most abundant pPB species. These are PB synapses (PB–int–rdfs1, PB–int–rdfs2) in C and D, and free pPB, pPB bound by one (PB–int–rdf1) or two (PB–int–rdf) int2–rdf2 complexes in D. Note that the ‘permitted’ reactions (A and C) quickly approach equilibrium, with predominant formation of the final products LR–ints2 (A) or PB–int–rdfs2 (C), in contrast to the ‘non-permitted’ reactions (B and D). Simulations were for 400 nM integrase, 10 nM pPB or pLR substrate and 800 nM RDF (for C and D).

