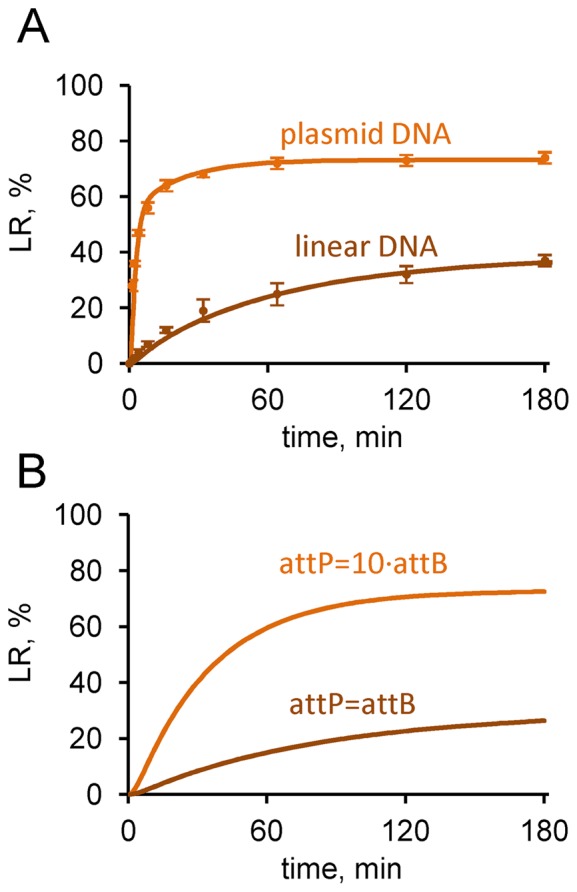
Figure 7.

Kinetics of ϕC31 integrase-mediated recombination of linear attP and attB substrates. (A) Comparison of experimentally measured and modelled time courses with plasmid and linear substrates. Experimental data are shown by symbols and simulations by lines. Experiments and simulations were done with 400 nM integrase and 10 nM pPB, or 10 nM each of attP and attB. Plasmid data are the same as in Figure 4E. (B) Simulated time courses with equal or different amounts of attP and attB substrates. Concentrations of substrates were 3 nM attP and 3 nM attB for the brown line, 3 nM attB and 30 nM attP for the orange line; integrase was at 200 nM. The product amount is shown relative to the total amount of attB.
