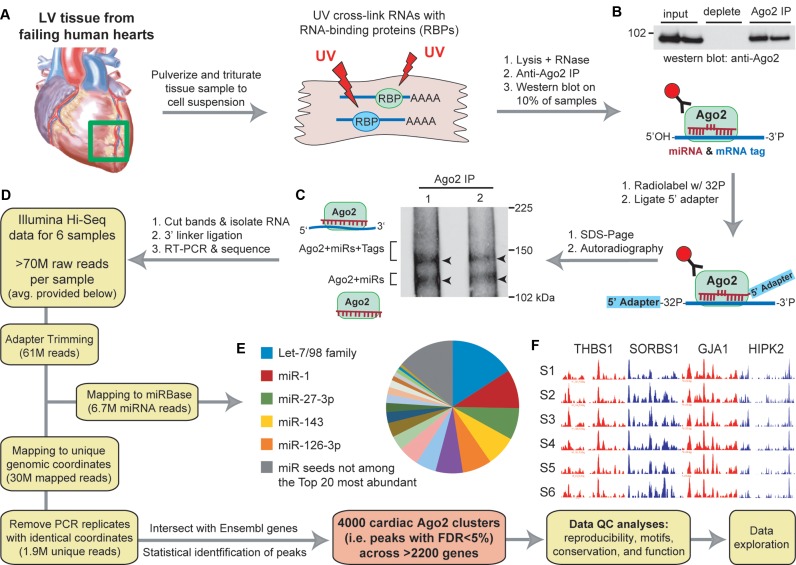
Figure 1.
Workflow for performing Ago2 HITS-CLIP in human heart (A–F). (A) Illustration depicting the processing of left ventricular cardiac tissues (n = 6 separate individuals). (B) Western blot showing immunoprecipitation of human Ago2 from heart tissues. (C) Autoradiography of Ago2 CLIP isolated 32P-labeled RNA:protein complexes resolved by SDS-PAGE showing the expected doublet corresponding to the designated complexes. (D) Diagram indicating the workflow for analyzing high-throughput sequencing data to obtain miR read information and cardiac Ago2 clusters (i.e. binding sites). The average number of reads per sample at each filtering step is provided. (E) Pie chart showing the relative abundance of miRs (grouped into families based on shared seed sequence) across all samples. (F) UCSC Genome Browser images of positional read coverage for each sample (S1–S6) illustrate the cross-sample data reproducibility. Images span the 3′-UTRs of the indicated genes, covering ∼7400 nts in total. Red and blue indicate positive and negative strand orientation, respectively. Figure scheme adapted from previously published work (5).

