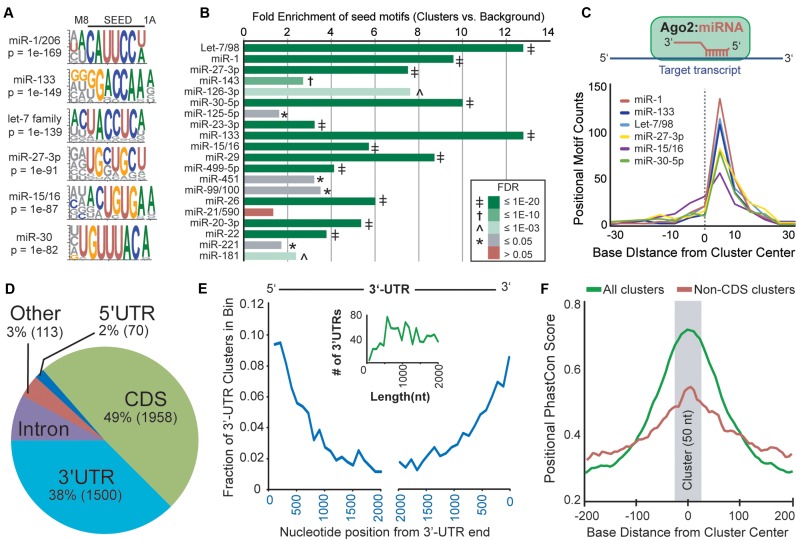
Figure 2.
Characterization of human cardiac Ago2 clusters. (A) Analysis of cluster sequences using the HOMER algorithm identified significantly enriched motifs corresponding to abundant cardiac miRs (sequence logos shown). (B) Relative combined enrichments of 7A1 and 7M8 sites corresponding to the top 20 most abundant miR seeds is shown. The significance of enrichment [Ago2 clusters vs. background (flanking sequences); FDR] is indicated by color key and symbol. (C) Plot summarizing the positional enrichment of motifs within clusters. The enriched motifs corresponding to abundant cardiac miRs are located to the right of center, consistent with miR:target recognition via reverse complementary Watson–Crick base-pairing, illustrated above. (D) The intragenic distribution of the 4000 human cardiac Ago2 clusters within mRNAs based on Ensembl gene annotations. CDS = coding regions. (E) The positional distribution of clusters within binned 3′-UTR locations is shown. The inset graph (green line) depicts the number of 3′-UTRs by length for genes containing 3′-UTR Ago2 clusters, supporting that the observed decrease in clusters distant from 3′-UTR ends is not length dependent. (F) The positional mean PhastCons scores within and near cardiac Ago2 clusters (∼50 nts, centered on zero) are shown for all clusters or non-CDS clusters only. For the latter, clusters overlapping coding regions were removed to avoid a potential bias for coding sequences showing increased conservation, particularly smaller exons flanked by less conserved intronic sequences.

