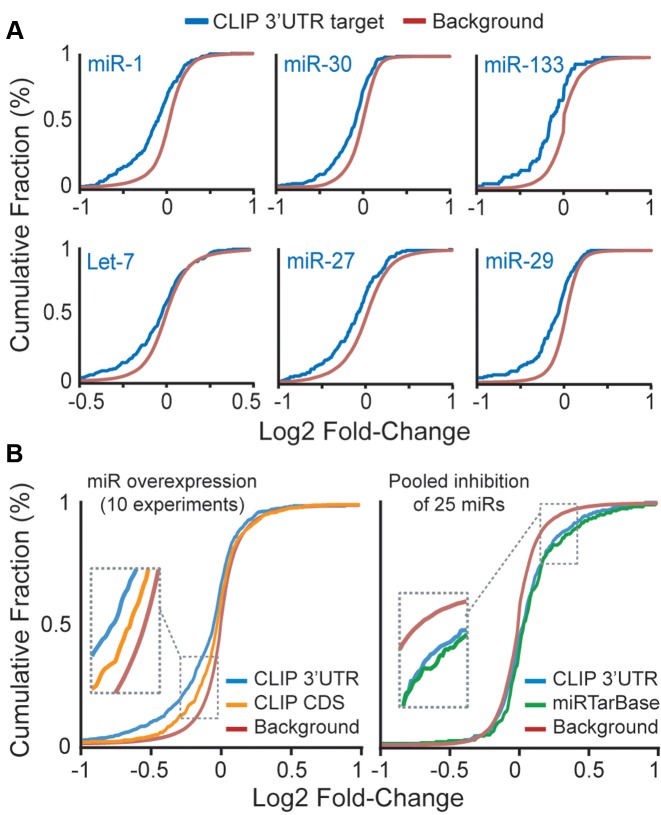
Figure 3.
Functionality of miR:target gene pairs identified by cardiac Ago2 HITS-CLIP. Functionality of miR:target gene pairs was determined using gene expression microarray data from miR overexpression or miR inhibition studies in human cell lines. Cumulative fraction curves for miR:target gene pairs (e.g. genes having 3′-UTR or CDS Ago2 HITS-CLIP clusters or experimentally-validated miR:target genes recorded in miRTarBase; each corresponding to the overexpressed or inhibited miRs in the microarray experiments) are plotted. Curve shifts to the left or right, relative to background genes (i.e. no site), indicates a general down- or up-regulation of the target genes, respectively. (A) Plots showing the down-regulation of target genes in several individual miR overexpression datasets. (B) Plots summarizing data from ten miR overexpression studies (left) and a single dataset for pooled miR inhibition (right).

