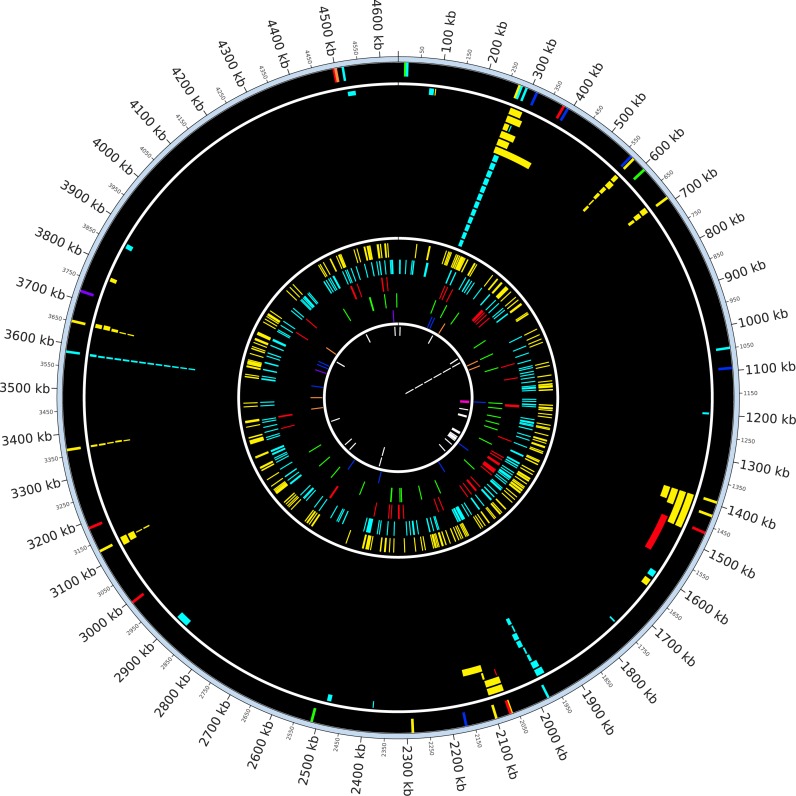
Figure 1.
Circos plot displaying large-scale rearrangements. Starting from the outer-most section to the inner-most section (each section separated by white ring), Circos plot displaying insertion sequence (IS) insertions in the founding strain, IS-associated deletions, novel IS insertions (each major IS family is drawn in an individual track) and other deletions (not associated with IS elements) recovered from mutation accumulation (MA) data. Colors indicate different IS families (IS5: yellow, IS1: cyan, IS2: red, IS186: green, IS3: blue, IS4: orange, IS150: purple, other deletions: white). A magenta band in the other deletion section indicates an e14 deletion that occurred 21 times and it is drawn as single band due to space limitation. Spatial clustering of IS-associated deletions anchored around preexisting IS insertions can be seen.

