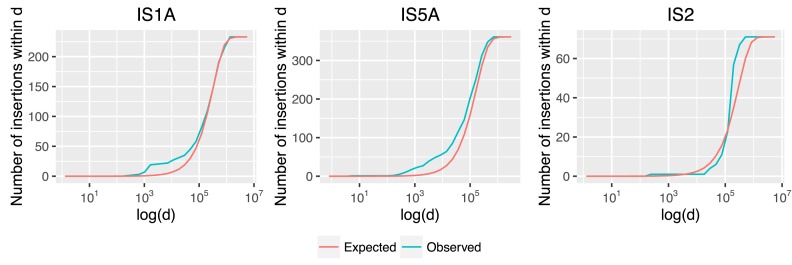
Figure 2.
Cumulative distribution of IS insertions within a distance threshold d. Insertions recovered in MA data are shown in blue (observed) and average counts using the 1000-permutation test are shown in red (expected). IS1A and IS5A exhibit bias for nearby insertions (small values of d in bp on x-axis; drawn in log scale) and IS2 shows bias for distant insertions.

