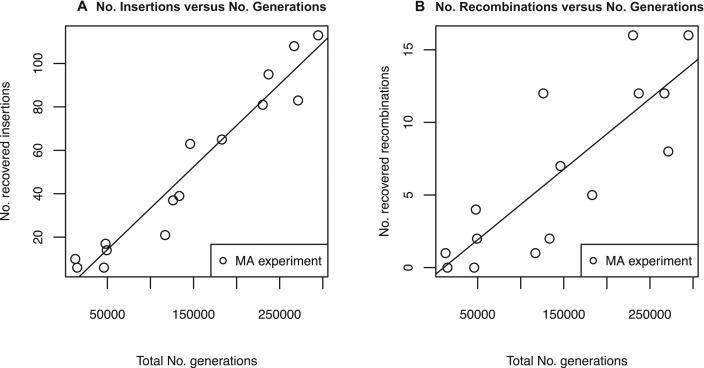
Figure 4.
IS insertion and recombination rates remain constant across MA experiment. Each data point represents the total number of novel IS insertions (A) and recombinations (B) detected in all MA lines in a single MA experiment (y-axis) versus the the total number of generations of these MA lines (Table 3). A linear regression line for insertion rate (A) is shown with a slope of ∼3.5 × 10⁻⁴ (R2 = 0.93, p = 2.78 × 10⁻⁹) and a linear regression line for recombination rate (B) is shown with a slope of ∼4.5 × 10⁻⁵ (R2 = 0.67, p = 1.59 × 10⁻⁴).

