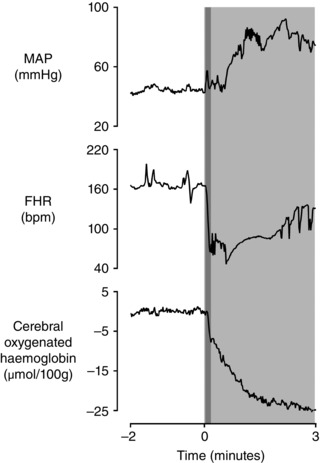
Figure 1. Relationship between mean arterial pressure (MAP, mmHg), fetal heart rate (FHR, beats min −1 (bpm)) and changes in cerebral oxygenated haemoglobin (μmol (100 g) −1 ), as measured by near‐infrared spectroscopy, during a prolonged complete umbilical cord occlusion in a near‐term fetal sheep (0.85 of gestation) .

The period of occlusion is shown in light grey. The overlapping dark grey area represents the initial and most rapid portion of the deceleration. Note how both FHR and cerebral oxygenated haemoglobin begin to fall in parallel at 6 s after the start of occlusion when MAP is not markedly higher than baseline. Data are 1 s averages. Cerebral oxygenated haemoglobin is shown relative to the average of the 2 min baseline period.
