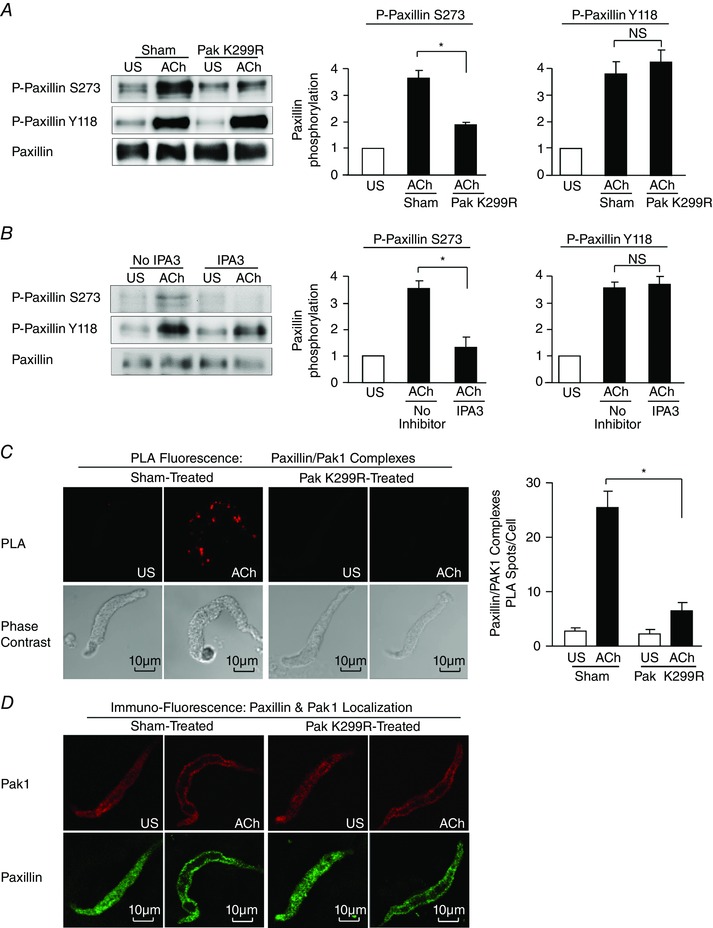
Figure 3. Pak regulates paxillin Ser273 phosphorylation in response to stimulation with ACh in tracheal smooth muscle tissues .

A, paxillin Tyr118 (Y118) phosphorylation and paxillin Ser273 (S273) phosphorylation were measured in tracheal smooth muscle tissues expressing the Pak K299R mutant or in sham‐treated tissues after 5 min ACh stimulation or unstimulated (US). Pak K299R significantly inhibited ACh‐induced paxillin Ser273 phosphorylation, but it did not significantly affect paxillin Tyr118 phosphorylation (n = 9). B, paxillin Tyr118 phosphorylation and paxillin Ser273 phosphorylation were measured in smooth muscle tissues treated with IPA3 or untreated (No inhibitor) tissues with or without 5 min ACh stimulation. IPA3 significantly inhibited ACh‐induced paxillin Ser273 phosphorylation, but it did not significantly affect paxillin Tyr118 phosphorylation (n = 4). C, in situ PLA shows the interaction of paxillin and Pak1 in freshly dissociated differentiated tracheal smooth muscle cells. PLA fluorescence and phase contrast images are shown for each unstimulated (US) and ACh‐stimulated cell. In cells from sham‐treated tissues, the mean number of PLA spots was significantly higher in ACh‐stimulated cells than in unstimulated cells (n = 49 for ACh, n = 22 for US). In cells from Pak K299R‐treated tissues, the mean number of PLA spots was very small and did not change significantly with ACh stimulation (n = 36 for ACh, n = 20 for US). Cells were dissociated from tissues obtained from four separate experiments. D, freshly dissociated tracheal smooth muscle cells were double stained by immunofluorescence to determine the localization of Pak1 and paxillin with or without ACh stimulation. ACh stimulation caused the recruitment of both Pak1 and paxillin from the cytoplasm to the cell membrane in both sham‐treated and Pak K299R‐treated tissues. One typical cell out of eight cells of each group is shown. All values are means ± SEM. *Significant difference between ACh‐stimulated tissues, P < 0.05. NS, not significantly different.
