
Figure 2. Rac1 regulated exercise‐induced GLUT4 translocation .
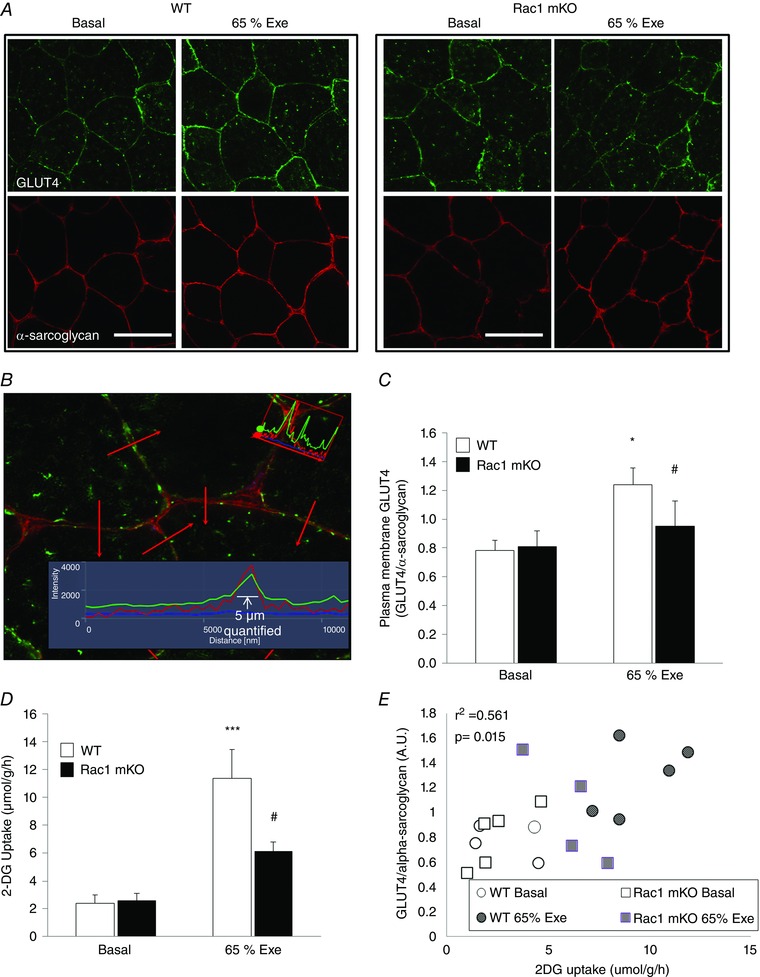
A, representative images showing cryosections of tibialis anterior muscle (cross sections) from basal and exercise‐stimulated Rac1 mKO and WT littermate mice stained with antibodies against GLUT4 (green) and α‐sarcoglycan (red). Scale bar = 50 μm. B, illustration of the quantification approach. Red arrows indicate the locations of the lines across and perpendicular to the plasma membrane of which 5 μm were analysed and quantified. C, quantification of the intensity of plasma membrane GLUT4 relative to α‐sarcoglycan in the basal and exercise‐stimulated (65% of individual maximal running speed, 20 min) state of WT and Rac1 mKO tibialis anterior muscle (n = 4–6). D, 2‐DG uptake in basal and exercise‐stimulated (65% of individual maximum running speed, 20 min) tibialis anterior muscle (n = 5 or 6). E, correlation between plasma membrane GLUT4 (GLUT4/α‐sarcoglycan) and 2‐DG uptake in basal and exercise‐stimulated tibialis anterior muscle. Included are only samples analysed for both parameters in the same muscle (n = 4 or 5). Significant difference between basal and exercise‐stimulated intensity of GLUT4/α‐sarcoglycan or 2‐DG uptake is indicated: * P < 0.05. Significant interaction between exercise and genotype is indicated: # P < 0.05. Values are the mean ± SEM.