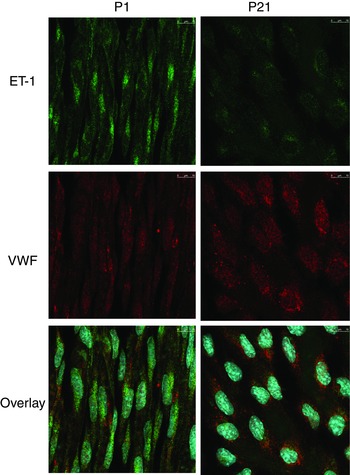
Figure 10. Representative laser scanning microscopy fluorescence images demonstrating the expression and localization of ET‐1 (green) and VWF (red) immunofluorescence in endothelial cells lining carotid arteries from P1 (newborn) and P21 mice .

The bottom images present overlays of ET‐1, VWF and nuclear staining (blue, Draq5).
