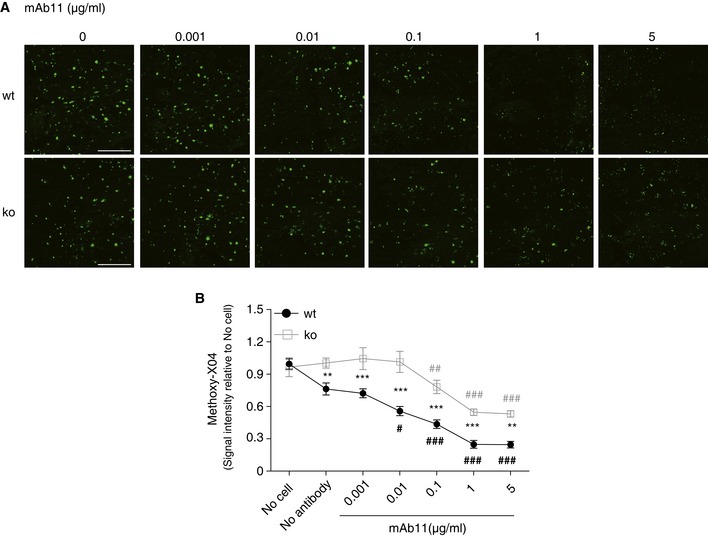
Methoxy‐X04 signals were quantified from the entire sagittal section. (n = 5, ± SEM; two‐way ANOVA, interaction P = 0.0082, genotype P < 0.0001, treatment P < 0.0001. Fisher's LSD post hoc comparisons; * show statistics between wt and ko under the same experimental condition. # in black shows wt compares to no‐antibody stimulation; # in gray shows ko compares to no‐antibody stimulation; wt vs. ko for the following conditions: no antibody P = 0.0053, mAb11 0.001 μg/ml P = 0.0003, mAb11 0.01 μg/ml P < 0.0001, mAb11 0.1 μg/ml P = 0.0001, mAb11 1 μg/ml P = 0.0007, mAb11 5 μg/ml P = 0.0011; following conditions compare to wt/no antibody: wt/mAb11 0.01 μg/ml P = 0.0166, wt/mAb11 0.1 μg/ml P = 0.0002, wt/mAb11 1 μg/ml P < 0.0001, wt/mAb11 5 μg/ml P < 0.0001; following conditions compare to ko/no antibody: ko/mAb11 0.1 μg/ml P = 0.0099, ko/mAb11 1 μg/ml P < 0.0001, ko/mAb11 5 μg/ml P < 0.0001.

