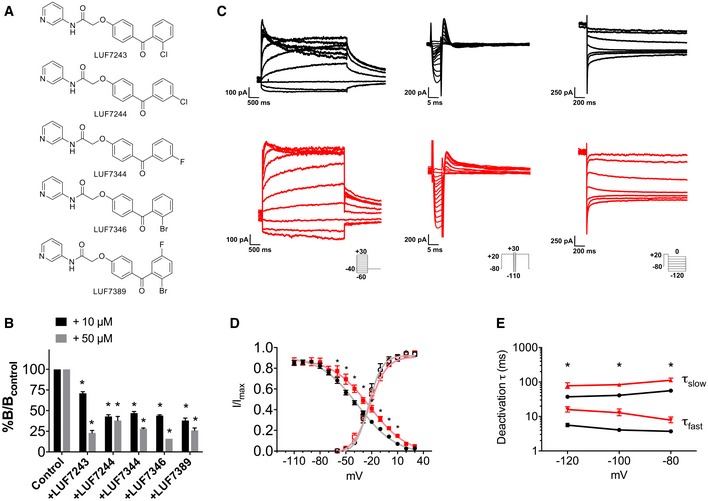
Chemical structures of LUF7243, LUF7244, LUF7344, LUF7346 and LUF7389.
Percentage of specific binding of [3H]dofetilide to the hERG channel after 6 min of dissociation induced by 10 μM dofetilide in the absence (control) or presence of 10 and 50 μM of LUF compounds. The specific binding of [3H]dofetilide in the absence of test compounds was set as B
control, while the specific binding in their presence was set as B. *P < 0.05 versus control; N = 3–4.
Representative traces of hERG activation (left), inactivation (middle) and deactivation (right) measured in HEK293 hERG cells under baseline conditions (black) and in the presence of 3 μM LUF7346 (red). Insets: voltage‐clamp protocols.
Steady‐state activation (empty symbols) and inactivation (filled symbols) curves for IKr under baseline conditions (black) and in the presence of 3 μM LUF7346 (red). The corresponding Boltzmann's fittings are superimposed to data points. *P < 0.05 versus baseline. N = 11–14.
Plot of the time constants (τ) of deactivation derived from biexponential fittings under baseline conditions (black) and in the presence of 3 μM LUF7346 (red). *P < 0.05 versus respective baseline. N = 8.
Data information: (B) Two‐tailed unpaired
t‐test.
P < 0.0001 for all tested LUF compounds compared to the control group at both 10 and 50 μM. (D) Repeated‐measures two‐way ANOVA with Sidak's multiple comparisons test. Adjusted
P‐values for inactivation: −100 mV: > 0.9999; −90 mV: > 0.9999; −80 mV: 0.3922; −70 mV: 0.9636; −60 mV: 0.0006; −50 mV: < 0.0001; −40 mV: < 0.0001; −30 mV: < 0.0001; −20 mV: < 0.0001; −10 mV: < 0.0001; −10 mV: 0.0011; 0 mV: 0.0111; 10 mV: 0.0343; 20 mV: 0.4871; 30 mV: > 0.9999. Adjusted
P‐values for activation: −60 mV: > 0.9999; −50 mV: 0.9998; −40 mV: > 0.9999; −30 mV: 0.8854; −20 mV: 0.2129; −10 mV: 0.1188; 0 mV: 0.9944; 10 mV: > 0.9999; 20 mV: 0.8340; 30 mV: 0.9841. (E) Paired two‐way ANOVA with Sidak's multiple comparisons test. Adjusted
P‐values for deactivation τ
fast: −120 mV: 0.01, −100 mV: < 0.0001, −80 mV: < 0.0001. Adjusted
P‐values for deactivation τ
slow: −120 mV: 0.01, −100 mV: < 0.0001, −80 mV: < 0.0001. (B, D, E) Data are expressed and plotted as the mean ± SEM.