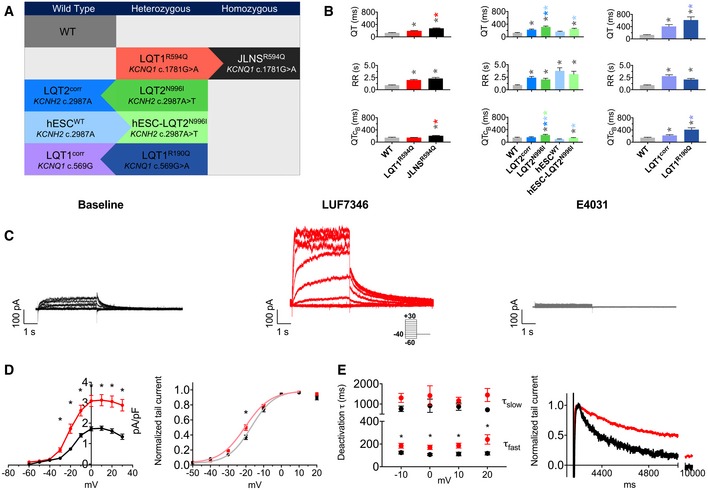
Summary of the hPSC lines used in this study. WT, wild‐type healthy control; LQT1R594Q and JLNSR594Q, isogenic pair harbouring the heterozygous and the homozygous KCNQ1 c.1781G > A mutation, respectively; LQT2N996I and LQT2corr, isogenic pair in which the heterozygous c.2987A > T KCNH2 mutation is present or corrected, respectively; hESCWT and hESC‐LQT2N996I, isogenic pair in which KCNH2 is wild type or the heterozygous c.2987A > T mutation was inserted, respectively; LQT1R190Q and LQT1corr, isogenic pair in which the heterozygous c.569G > A KCNQ1 mutation is present or corrected, respectively. Arrows indicate the parent line from which each genetically matched isogenic hiPSC were generated.
Baseline QT interval (top), baseline RR interval (middle) and baseline QT interval corrected with the Bazett's formula (bottom). Bar graphs are divided by isogenic pairs (LQT1R594Q and JLNSR594Q, left; LQT2corr, LQT2N996I, hESCWT and hESC‐LQT2N996I, middle; LQT1corr and LQT1R190Q, right), and in each graph, the unrelated WT is shown as a comparison. N = 17–53. *P < 0.05. The colour of the symbol indicates comparisons and relative statistical significance.
Representative traces of IKr steady‐state activation in WT hiPSC‐CMs in Tyrode (left), in the presence of 5 μM LUF7346 (middle) and after the application of 5 μM E4031 to selectively block IKr (right). Inset: voltage‐clamp protocol.
Average I/V relationships (left) and steady‐state activation curves with superimposed Boltzmann's fittings (right) under baseline conditions (black) and in the presence of 5 μM LUF7346 (red). *P < 0.05. N = 19.
Plot of the time constants (τ) of deactivation derived from biexponential fits (left) and representative examples (right) under baseline conditions (black) and in the presence of 3 μM LUF7346 (red). *P < 0.05. N = 17–21.
Data information: Kruskal–Wallis tests with pairwise Dunn's multiple testing correction. (B) Adjusted
P‐values for QT: WT versus LQT1
R594Q: 0.0029; WT versus JLNS
R594Q: < 0.0001; LQT1
R594Q versus JLNS
R594Q: < 0.0001. WT versus LQT2
corr: 0.0238; WT versus LQT2
N996I: < 0.0001; WT versus hESC‐LQT2
N996I: 0.0034; LQT2
corr versus LQT
N996I: 0.0151; LQT2
N996I versus hESC
WT: < 0.0001; hESC
WT versus hESC‐LQT2
N996I: 0.0367. WT versus LQT1
corr: 0.0098; WT versus LQT1
R190Q: < 0.0001. LQT1
corr versus LQT1
R190Q: 0.0327. Adjusted
P‐values for RR: WT versus LQT1
R594Q: < 0.0001; WT versus JLNS
R594Q: < 0.0001. WT versus LQT2
corr: 0.0001; WT versus LQT2
N996I: 0.0031; WT versus hESC
WT: < 0.0001; WT versus hESC‐LQT2
N996I: < 0.0001. WT versus LQT1
corr: < 0.0001; WT versus LQT1
R190Q: 0.0012. Adjusted
P‐values for QTc
B: WT versus JLNS
R594Q: 0.0050; LQT1
R594Q versus JLNS
R594Q: < 0.0001. WT versus LQT2
N996I: 0.0074; LQT2
corr versus LQT2
N996I: 0.0084. LQT2
N996I versus hESC
WT < 0.0001; LQT2
N996I versus hESC‐LQT2
N996I: 0.0008. WT versus LQT1
corr: 0.0303; WT versus LQT1
R190Q: < 0.0001. LQT1
corr versus LQT1
R190Q: 0.0018. (D) Paired two‐way ANOVA with Sidak's multiple comparisons test. Adjusted
P‐values for I/V plot: −60 mV: 0.9780; −50 mV: > 0.9999; −40 mV: > 0.9999; −30: 0.0037; −20 mV: < 0.0001; −10 mV: < 0.0001; 0 mV: < 0.0001; 10 mV: < 0.0001; 20 mV: < 0.0001; 30 mV: < 0.0001. Adjusted
P‐values for activation: −50 mV: 0.9987; −40 mV: > 0.9999; −30 mV: 0.4519; −20 mV: 0.0013; −10 mV: 0.8323; 0 mV: > 0.9999; 10 mV: 0.9999; 20 mV: 0.5892. (E) Unpaired two‐way ANOVA with Sidak's multiple comparisons test. Adjusted
P‐values for deactivation τ
fast: −10 mV: 0.0469; 0 mV: 0.0358; 10 mV: 0.0103; 20 mV: < 0.0001. Adjusted
P‐values for deactivation τ
slow: −10 mV: 0.5008; 0 mV: 0.5740; 10 mV: 0.9024; 20 mV: 0.2181. (B, D, E) Data are expressed and plotted as the mean ± SEM.
Source data are available online for this figure.