-
A, B
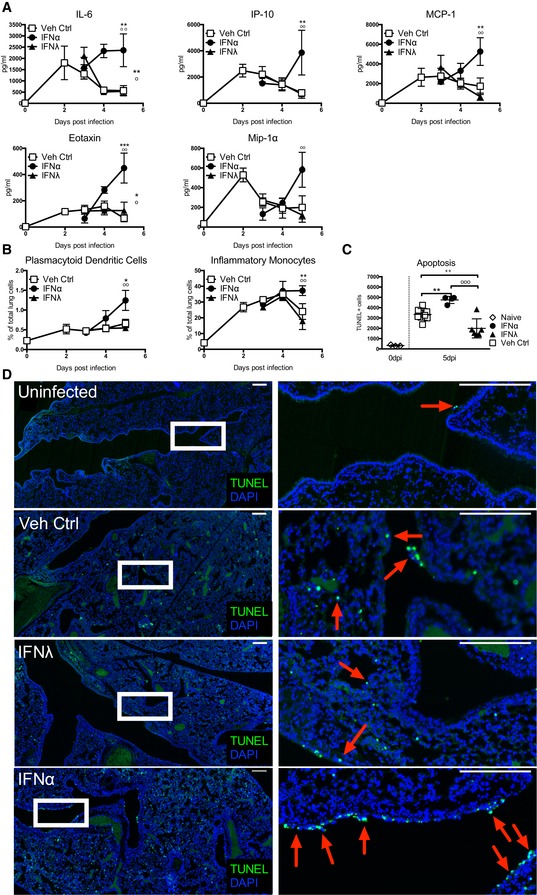
Mice were infected with PR8 and treated with IFNα (circles, 1.45 μg/50 μl), IFNλ (triangles, 2.6 μg/50 μl) or Veh Ctrl (squares) as previously stated. Concentrations of stated proinflammatory cytokines in BAL fluid were measured by multiplex cytokine assay (A) and flow cytometric quantification of pDCs and inflammatory monocytes in the lung was performed (B) (data shown are representative of two independent experiments, n = 2–6).
-
C, D
Lung sections from control and infected mice treated as indicated were stained by TUNEL for apoptotic cells at 6 dpi. Quantification of TUNEL+ cells in whole lung slides by Icy‐Spot Detector (ICY‐R3M2Y2) (C) (data shown are pooled from three independent experiments, n = 3–8). Red arrowheads indicate TUNEL signal (D). Scale bar, 200 μM (data shown are representative of two independent experiments, n = 3–4).
Data information: Significance assessed by two‐way ANOVA with Bonferroni post‐tests (where *denotes IFNα:Veh Ctrl,
+indicates IFNλ:Veh Ctrl, and
°indicates IFNα:IFNλ). Symbols on the right of graphs indicate statistical significance of the whole curve. IL‐6 whole curve: **
P = 0.0041,
°
P = 0.0144. IL‐6 5 dpi: **
P = 0.001884,
°°
P = 0.001645. IP‐10 5 dpi: **
P = 0.004897,
°°
P = 0.005354. MCP‐1 5 dpi: **
P = 0.007473,
°°
P = 0.002003. Eotaxin whole curve: *
P = 0.0235,
°
P = 0.0386. Eotaxin 5 dpi ***
P = 0.000149,
°°
P = 0.001975. Mip‐1α 5 dpi:
°°
P = 0.002921 (A). Plasmacytoid dendritic cells: *
P = 0.0211,
°°
P = 0.006965. Inflammatory monocytes **
P = 0.007842,
°°
P = 0.000895 (B). **
P = 0.0011,
++
P = 0.0051,
°°°
P = 0.0005 (C). Graphs show mean ± SEM.