
Figure EV2. Immune cell recruitment and lymphocyte activation upon IFNα and IFNλ treatment.
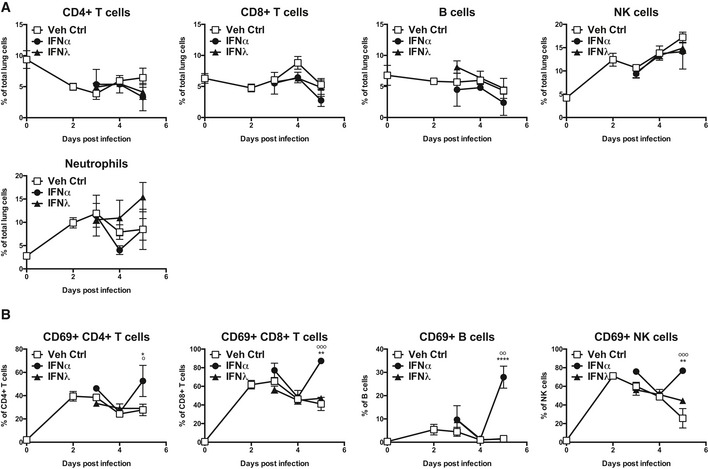
Mice were infected with PR8 and treated with IFNα (circles, 1.45 μg/50 μl), IFNλ (triangles, 2.6 μg/50 μl) or Veh Ctrl (squares, 50 μl PBS). Flow cytometric quantification (A) of lymphocyte subsets and neutrophils and (B) of CD69 expression on lymphocytes in the lung was performed (data are representative of two independent experiments, n = 3–5). Significance assessed by two‐way ANOVA where *indicates IFNα:Veh Ctrl and °indicates IFNα:IFNλ. IFNλ:Veh Ctrl was not significant. CD69+ CD4+ T cells: *P = 0.0159, ° P = 0.0138. CD69+ CD8+ T cells: **P = 0.002, °°° P = 0.0003. CD69+ B cells: ****P < 0.0001, °° P = 0.0069. CD69+ NK cells: **P = 0.0012, °°° P = 0.0005 (B). Graphs show mean ± SEM.