-
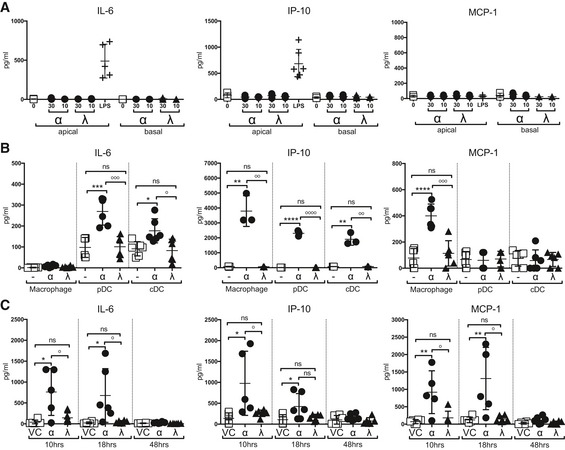
A, B
IL‐6, IP‐10 and MCP‐1 concentrations were measured by multiplex cytokine assay in AEC culture supernatants (A) and macrophage, pDC and cDC culture supernatants (B) at 24 h post‐stimulation with IFNα4 (0.725 ng/ml) or IFNλ2 (1.3 ng/ml) or LPS (AEC only) (data shown are representative of two independent experiments, n = 3–6).
-
C
BAL samples taken from mice treated with IFNα, IFNλ or Veh Ctrl at specified time points (data shown are representative of two independent experiments, n = 5–6).
Data information: Significance assessed by unpaired
t‐tests where *denotes IFNα:Veh Ctrl and
°indicates IFNα:IFNλ. IFNλ:Veh Ctrl was not significant. IL6 pDC: ***
P = 0.0004,
°°°
P = 0.0005, IL6 cDC: *
P = 0.0102,
°
P = 0.0151. IP‐10 macrophage: **
P = 0.0033,
°°
P = 0.0033, pDC: ****
P < 0.0001,
°°°°
P < 0.0001, cDC: **
P = 0.0013,
°°
P = 0.0013, MCP‐1 macrophage: ****
P < 0.0001,
°°°
P = 0.003 (B). IL‐6 10 h: *
P = 0.0112,
°
P = 0.0262, 18 h: *
P = 0.0314,
°
P = 0.373. IP‐10 10 h: *
P = 0.0261,
°
P = 0.0472. MCP‐1 10 h: **
P = 0.0081,
°
P = 0.0206, 18 h: **
P = 0.0089,
°
P = 0.01 (C). Graphs show mean ± SEM.