
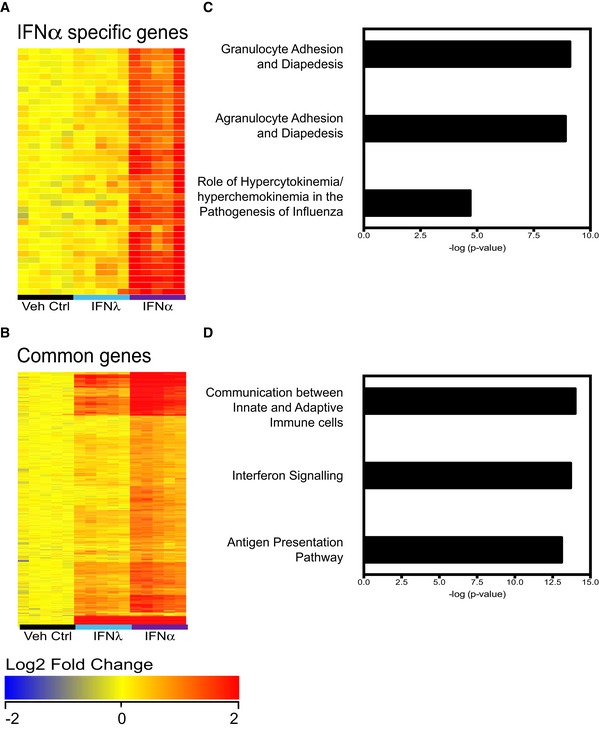
Figure 4. Pathogenicity‐related gene clusters are specifically induced by IFNα, not by IFNλ treatment.
-
A–DMice were treated with IFNα (1.45 μg/50 μl), IFNλ (2.6 μg/50 μl) or Veh Ctrl (50 μl PBS), and whole lungs were taken at 18 h post‐treatment for global analysis by Illumina.SingleColor.Mouse WG‐6V20R01127 microarrays. Samples (n = 5) were normalized to the median of the vehicle control group and filtered for a fold change of 1.5, yielding 553 genes differently regulated between treatments (one‐way ANOVA, P < 0.01, Benjamini–Hochberg multiple test correction), of which 429 genes are upregulated. K‐means clustering revealed six gene clusters, one of which encompassed genes primarily induced by IFNα4 (A), while the remaining clusters contained genes upregulated by both IFNα4 and IFNλ2 (B). The two clusters of genes were analysed by Ingenuity Pathway Analysis (IPA) (C, D).