Fig. 5.

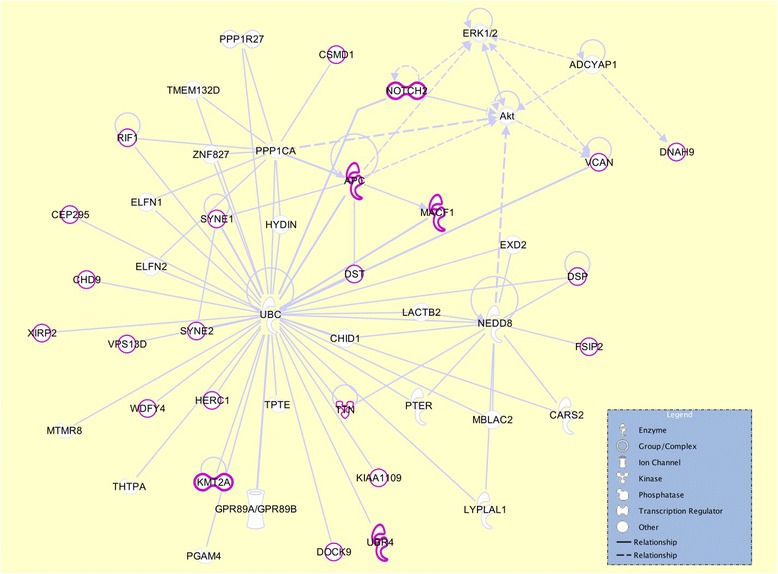
Interaction network analysis of the top 25 genes. The image shows the interactions of the top 25 genes with highest mutation load in the late-stage-enriched cluster compared to the early-stage-enriched cluster of patients

Interaction network analysis of the top 25 genes. The image shows the interactions of the top 25 genes with highest mutation load in the late-stage-enriched cluster compared to the early-stage-enriched cluster of patients