
Fig. 3.
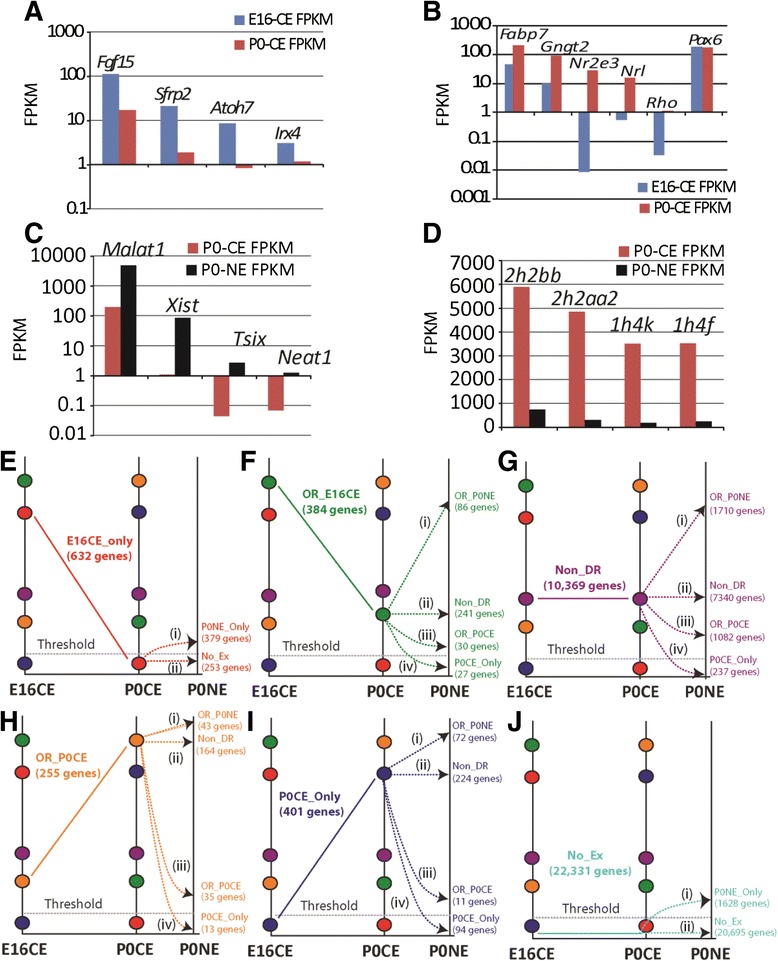
Validation of high-resolution transcriptome by RNA-Seq. a–d Expression of genes with established expression kinetics including a Fgf15, Sfrp2, Atoh7, Irx4, b Fabp7, Gngt2, Nr2e3, Nrl, Rho, Pax6, c Malat1, Xist, Tsix, Neat1, d Hist2h2bb, Hist2h2aa2, Hist1h4k and Hist1h4f shown as bar graph with FPKM in y-axis (log scale for a–c) between E16CE (blue), P0CE (red), and P0NE (black). e–j Combined E16CE-P0CE and P0CE-P0NE high-resolution transcription kinetics, E16CE_Only (e), OR_E16CE (f), Non_DR (g), OR_P0CE (h), P0CE_Only (i) and No_Ex (j). OR_E16CE - Over represented in E16CE; OR_P0CE – Over represented in P0CE; Non_DR – Non-differentially represented