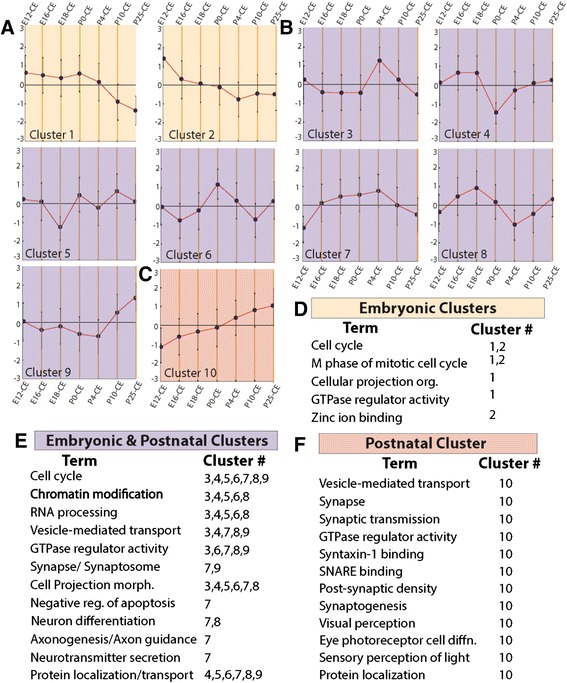
Fig. 5.

Custom microarray revealed isoform/gene expression coherence and validated RNA-Seq. a–c. Shown here is a centroid view of K-means clusters of isoform-specific probes across retinal development (Clusters given in Additional file 4: Table S3). The y-axis shows arbitrary units (−3 to 3) of expression and the developmental time is shown on top and bottom. d–f Selected GO terms enriched by DAVID analysis for genes in clusters (a-c)
