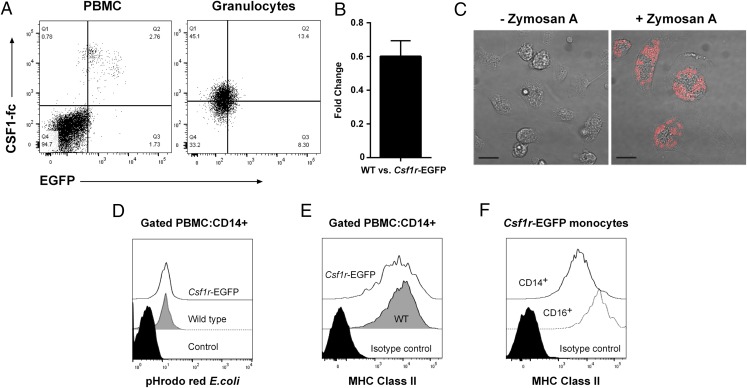
FIGURE 6.
(A) Freshly isolated blood from wild type and Csf1r-EGFP sheep was analyzed via flow cytometry for binding of CSF1-Fc and EGFP expression. PBMCs and granulocytes were gated via FSC/SSC profiles and dead cells excluded with Zombie Violet. Quadrants were set with wild type sheep blood. Dot plots are representative of three Csf1r-EGFP sheep and two repeat experiments. (B) Quantitative PCR was used to determine the fold change of Csf1r expression between wild type and Csf1r-EGFP sheep BMDMs (n = 4 per group). (C) PBMCs from Csf1r-EGFP sheep were differentiated into macrophages with rhCSF1. Phagocytosis assays performed with Zymosan A S. cerevisiae BioParticles and viewed by confocal microscopy. Images are representative of two MDMs and two BMDMs. Scale bars, 20 μm. (D) Phagocytosis assays were performed on freshly drawn blood from Csf1r-EGFP sheep and wild type controls using pHrodo Red E.coli BioParticles. CD14+ monocytes were gated in the PBMC fraction by flow cytometry. Results are representative of four wild type and six Csf1r-EGFP sheep. The control contained BioParticles and was incubated on ice. (E) Representative histograms of MHC class II expression in CD14+ PBMCs from wild type (n = 5) and Csf1r-EGFP (n = 7) sheep, analyzed by flow cytometry. (F) Representative histograms of MHC class II expression in CD14+ and CD16+ (GFPhi) monocytes from Csf1r-EGFP sheep (n = 5), analyzed by flow cytometry.

