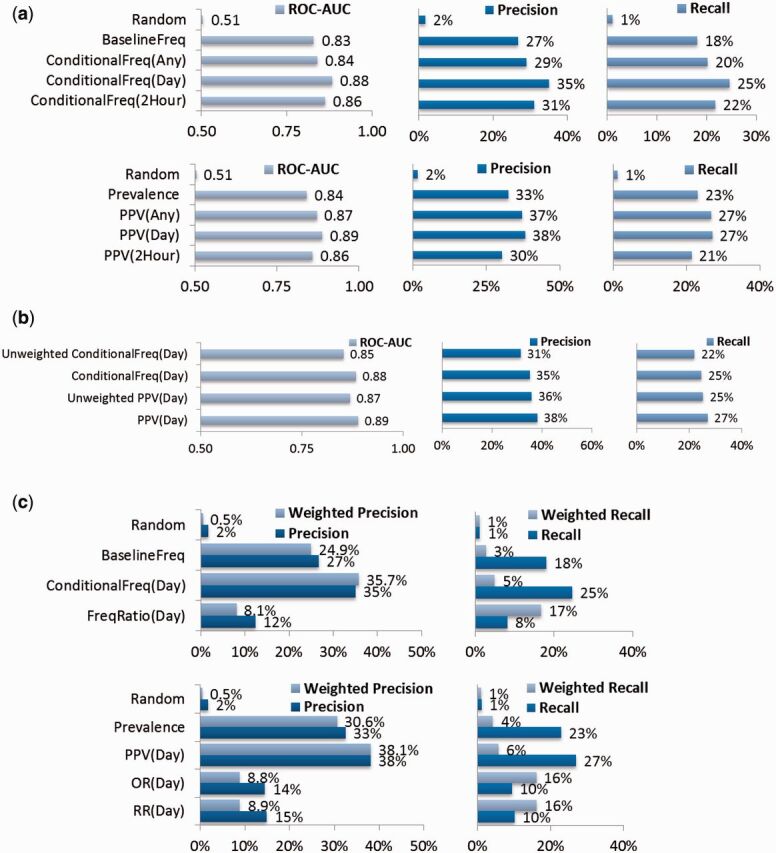
Figure 3:

(A) – Accuracy of clinical order recommendations using different parameters. For 1903 validation patients, clinical items from the first 4 h of their hospital encounter are used to query for a ranked list of clinical order recommendations. Each recommended list is validated against the actual set of new orders occurring within 24 h of hospitalization. Metrics include average receiver operating characteristic area under curve (ROC AUC) (c-statistic) and top 10 recommendation precision (positive predictive value) and recall (sensitivity). Ranking by BaselineFreq serves as a reference benchmark. ConditionalFreq methods are further refined by what time threshold t was used when counting item co-occurrences. The Prevalence (pretest probability) and PPV (positive-predictive value ∼ post-test probability) methods are directly analogous to BaselineFreq and ConditionalFreq, except they count patients with item co-occurrences, ignoring repeat items. Two-tailed, paired t -tests for the first row results compared to the BaselineFreq benchmark all yield P < 10 −16 , while second row results compared to the Prevalence benchmark all yield P < 10 −10 . (B) Accuracy of clinical order recommendations/predictions using simple unweighted averaging vs the default weighted averaging of underlying count statistics to favor the influence of less common, more specific query items. Two-tailed, paired t -tests of respective unweighted vs weighted aggregation methods all yield P < 10 −27 . (C) Inverse frequency weighted accuracy of clinical order recommendations, all using a time threshold t = 1 day and considering the top 10 recommendations. Two-tailed, paired t -tests for first row results compared to the ConditionalFreq(Day) method all yield P < 10 −29 , while second row results compared to the PPV(Day) method all yield P < 10 −16 .
